Exciting Announcement! In celebration of launching our AI Certification, we’re thrilled to offer a 50% discount exclusively. Seize this unique chance—don’t let it slip by!
At Aviz Networks, we’re dedicated to revolutionizing AI networking solutions by introducing AI for Networks and Networks for AI. Our strategic collaboration with Marvell, a global leader in semiconductor innovation, marks a significant step towards driving the adoption of SONiC. This partnership leverages Marvell’s cutting-edge switch technology and our Open Network Enterprise Suite (ONES) to deliver advanced AI Fabric capabilities and SONiC solutions for edge deployments. By integrating these technologies, we address the increasing demands of AI-driven applications, catering to both core and edge network environments with tailored solutions.
SONiC for AI Fabric and Edge: Distinct Use Cases
Our collaboration with Marvell focuses on two distinct use cases: SONiC for AI fabric and for edge deployments. Each serves a unique purpose in the evolving landscape of AI-driven networking.
SONiC for AI Fabrics
The combination of Marvell’s switch technology and Aviz Networks’ ONES platform provides a robust solution for core network environments. This integrated approach delivers:
Enhanced Performance: Superior performance for AI-driven applications, ensuring efficient data handling and reduced latency. This is powered by ONES' unique capability of Orchestration and Observability for RoCE traffic.
Scalability: Scalable networking infrastructure capable of supporting the growing demands of AI workloads from edge to cloud environments. ONES' horizontally scalable design ensures that no matter how big the AI Fabric grows, network operators can manage it from a single pane of glass.
Reliability: Advanced real-time visibility and anomaly detection features enhance network reliability and ensure uninterrupted AI operations. ONES' RoCE-specific anomaly detection ensures the network reliably delivers packets end to end.
SONiC for Edge Deployments
The PENS (PoE Edge Networks with SONiC) workgroup, formed in collaboration with Aviz Networks, the Linux Foundation, Marvell, and others, adapts SONiC for edge LANs. This initiative integrates specialized protocols essential for enhancing connectivity and network efficiency at the enterprise edge. Key benefits include:
Localized AI Processing: By deploying SONiC solutions at the edge, enterprises can process AI workloads locally, reducing latency and improving response times for real-time applications.
Cost Efficiency: Minimizing the need for extensive data transport to centralized cloud locations results in cost savings on bandwidth and improves overall efficiency.
Enhanced Security: Processing data at the edge enhances security by keeping sensitive information local and reducing the risk of data breaches during transmission.
Aviz Networks and Marvell: A Best-of-Breed Disaggregated Offering
The collaboration between Marvell and Aviz Networks provides cloud and enterprise data centers with a SONiC-based solution using Marvell switch silicon. Marvell delivers switch silicon with SAI (Switch Abstraction Interface) to integrate seamlessly with open-source SONiC, while we at Aviz Networks offer disaggregated support and services alongside cloud-native applications. Aviz Networks’ ONES (Open Networking Enterprise Suite) stack provides orchestration, telemetry, assurance, and support, ensuring that key network metrics meet SLAs and offering insights into real-time network health.
Successful Deployment and Future Prospects
Together, Marvell and Aviz Networks have successfully deployed hundreds of 400G fabric switches with SONiC running on Marvell silicon in enterprise data centers. These leaf and spine switches, equipped with 100G and 400G ports, deliver industry-leading innovation, a choice of optics, and broad skill-set availability, resulting in significant OPEX and CAPEX savings. We anticipate extending this successful collaboration to many more enterprise and cloud data center operators as the benefits of disaggregated networking become more widely understood and embraced.
Voices from the Partnership
We are excited to collaborate with Aviz Networks to enhance AI-driven networking solutions. Our switch technology, combined with Aviz Networks' expertise in AI fabric management and SONiC for edge deployments, will provide customers with a powerful, scalable, and reliable network infrastructure.
Our partnership with Marvell is a testament to our dedication to advancing AI-driven networking solutions. By combining our innovative ONES platform with Marvell's leading switch technology, we are poised to deliver unparalleled performance and reliability for our customers, both at the core and the edge.
Today, the open source and network communities recognize SONiC as the next ‘big thing’ to accelerate innovation and growth. And that’s undoubtedly true. SONiC is fundamental in building next-generation networks. However, deploying and monitoring a SONiC network is not a cakewalk that simply requires a “download, install and complete” approach.
Through this article, I, Krupakar Annam, would like to share my journey with SONiC, and how it can empower enterprises across the globe.
With a burning passion for innovation and a drive to make a real impact, I eagerly took on the challenge of leading the development team. And let me tell you, it has been an exhilarating journey. What sets our product ideas apart is that we’re not building yet another SONiC Distro or a yet another NetOps solution. In fact, making a Distro has never been a part of our plan. Our main focus is to enable customers to migrate and manage SONiC at a reasonable cost along with a lightning-fast speed. It’s a win-win situation for them, isn’t it?
Pioneering the Future of Networking with ONES
As I delved deeper into the world of SONiC, I became more confident about its untapped opportunities to transform the networking landscape. Most importantly, the power of open-source, the flexibility of disaggregated networks, and the promise of cost-effective scalability—all aligned perfectly with Aviz Networks’ vision.
And as my journey continued with this company, we went the extra mile together to understand the challenges and came up with an industry-leading solution. Here are the details:
- Pain Points of SONiC Adaptation and Management
Though SONiC is open-source, there is no single NetOps-like tool that can support multi-vendor environments. On the other hand, the available solutions are tied to specific vendors.
The pain points do not end here. There is no unified solution to handle the pre-deployment process for a multi-vendor DC fabric, whether it involves re-validating use case scenarios or creating a unified solution to bring vendors together for support.
Furthermore, there is also a lack of an all-in-one solution for multi-vendor visibility, orchestration, and supportability that makes it easier to manage DC and make more accurate decisions quickly.
We also realized many customers who are using SONiC or willing to adopt it, ultimately end up with ad hoc solutions by putting together in-house or open-source tools. These solutions are bound by specific use cases and may have limitations in pulling in-depth metrics offered by SONiC—leading to a painful process while transforming the DC fabrics.
- The Game Changer Solution
They say it right, understanding the challenges is the key to better innovations. And that’s what drove us to create ONES (Open Networking Enterprise Suite).
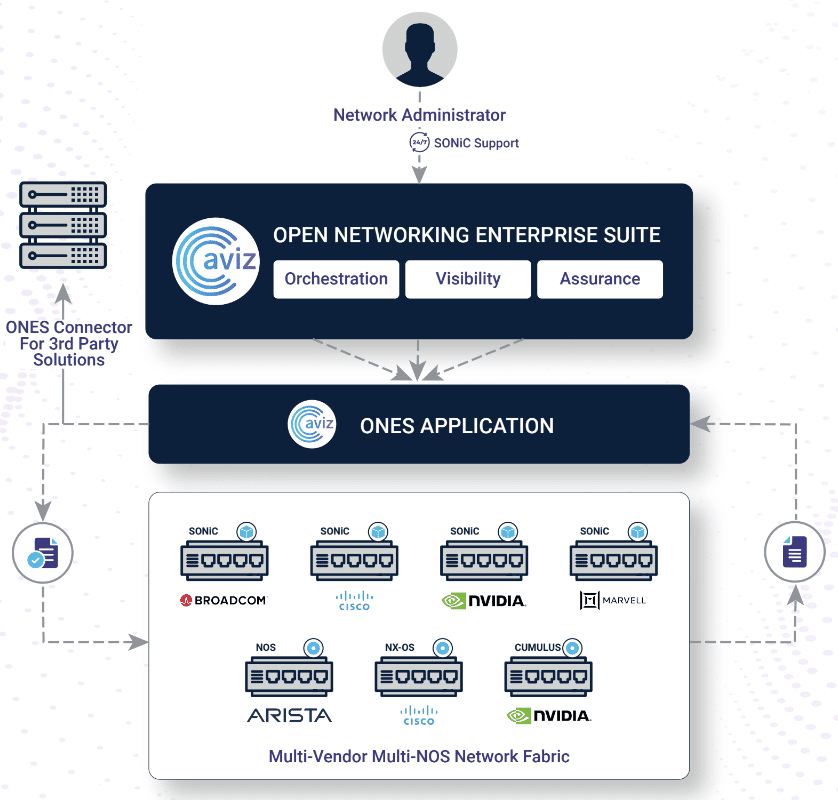
It’s a comprehensive, flexible, and unified stack solution. ONES can support multi-vendor SONiC platforms while adapting to or managing SONiC-based networks’ pre-deployment, orchestration, visibility, and supportability aspects of their DC network.
Our approach is centered on streamlining Day 1, and Day 2 operations of the DC network with the belief that our stack solution can run on any SONiC platform (regardless of the underlying hardware) and cater to diverse customer use cases. Whether it’s through a user-friendly GUI or robust APIs, it should be a rock-solid supportability tool for SONiC-based DC fabrics.
Challenges and Achievements in Implementing ONES Stack for SONiC Platforms and Beyond
- Unifying Network Configuration for Multi-Vendor Environment
The challenge here was to accommodate all vendor-specific configuration methods in a single go.
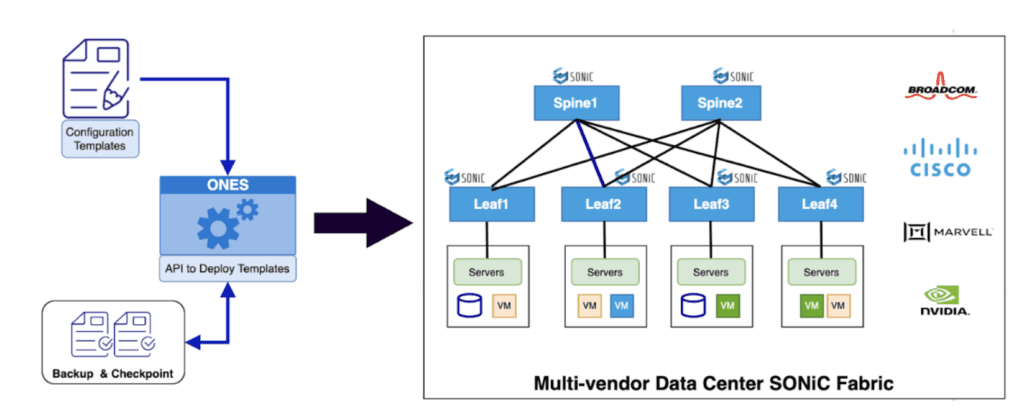
To address this, our solution has a common intent-based template that takes the fabric-level configurations, and the ONES orchestration layer with the intelligence to split that into vendor-specific configurations. The ONES orchestration agent running on the specific device will take care of pushing the right config to the device using CLIs and ConfigDB.
The SONiC CLI is incomplete or not a unified way of configuring and managing all available features on a device. So we have come up with FMCLI (Fabric Manager Command Line Interface), which is far more flexible and easier to adapt than SONiC CLI.
It wasn’t an easy task as we needed to decode each unique use case of many customers and include all of them without disrupting the intent of the solution we were building. What started with one or two community SONiC support has kept expanding orchestration via intent-based configuration for large networks (IPCLOS, L2 VXLAN MCLAG, L3 VXLAN MCLAG, FRR, etc.).
Furthermore, the network configuration APIs of ONES are exposed with an easily usable Python SDK to help the current infrastructure of DC adapt to ONES easily.
- Normalizing Multi-Vendor Deep Metrics for Visibility
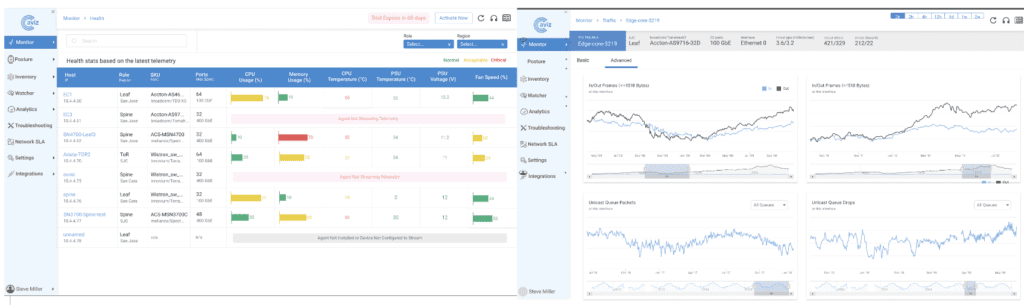
The challenge was to pull in deep metrics at regular intervals and normalize them for unified visibility. We developed a telemetry layer that pulls 200+ metrics using gNMI and normalizes them. For deep metrics data, we have gone beyond RedisDB. Our goal is to provide maximum metrics in a presentable format to help network operators correlate and diagnose issues to make quicker decisions.
We have open sourced ONES Valdiated Designs (https://ovd.ai/), they can help to integrate ONES seemlessly into your existing infrastructure.
- Accommodating Multi-NOS Environment
We cannot expect DC fabrics to run on SONiC alone. For customers looking for migration to SONiC, they might choose to go in a phased manner. As a result, we may end up in a situation where SONiC and non-SONiC devices coexist in the same fabric. This presents a unique challenge since non-SONiC devices are proprietary, and well-established vendor-specific NetOps tools are available to manage them.
So with ONES, customers can visualize non-SONIC devices in the same fabric and limited metrics along with SONiC devices. This is achieved by using eAPIs, NVAPIs and of course, normalized metrics for visualization.
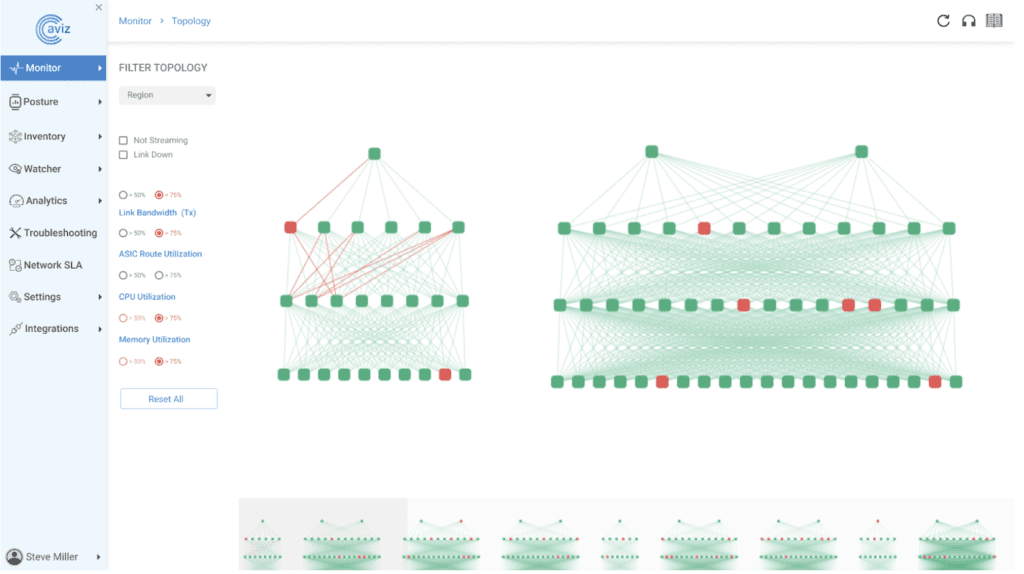
Furthermore, we have devised a distinct method to display the entire fabric in its topology while also enhancing it with alerts, rules, and other capabilities.
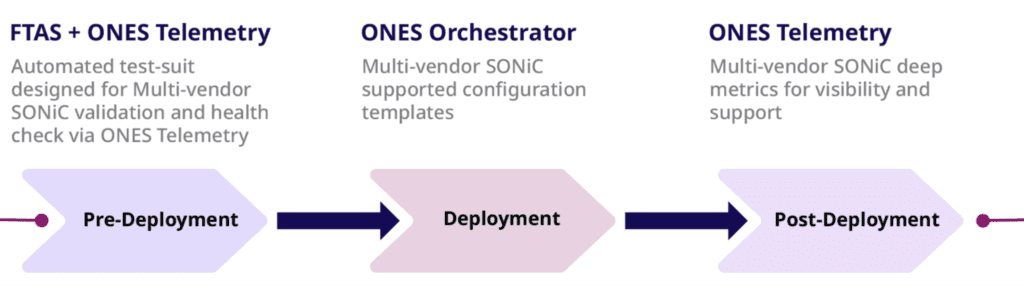
Transforming ONES into a Complete Deployment Solution
Our goal of supporting the Day 1/Day 2 (pre-deployment/deployment/post-deployment) operation of DC fabric was complete when we integrated ONES with FTAS (Fabric Test Automation Suite). It is a continuous automation test suite designed for multi-vendor SONiC validation. FTAS can help with a quicker turnaround time for the pre-deployment phase. It is also integrated with ONES which gives complete visibility during the pre-deployment. You can find more information about FTAS here.
Orchestration functionality of ONES takes care of the deployment phase. Intent-based configuration YAML templates are tested and can be used for reference.
All these cutting-edge innovations only mark the initial stride towards Aviz Networks’ vision, and more is yet to come. With our strong team of support engineers, we are well-equipped to empower customers with a seamless SONiC journey using the ONES stack.
For further insights into ONES, please visit our website.
If you wish to get in touch with me, feel free to connect on LinkedIn here
FAQs
1. What is the ONES Stack and how does it simplify SONiC deployment and operations?
ONES (Open Networking Enterprise Suite) is a unified, vendor-agnostic platform that simplifies the Day 1, Day 2, and Day N operations of SONiC-based data center fabrics. It streamlines pre-deployment validation, orchestration, multi-vendor visibility, and supportability making SONiC adoption faster, cost-effective, and easier to manage across large-scale enterprise environments.
2. How does ONES handle multi-vendor network environments where SONiC and non-SONiC devices coexist?
ONES supports both SONiC and non-SONiC devices by pulling metrics using eAPIs, NVAPIs, and other interfaces, then normalizing the data for unified visibility. It enables full-fabric visualization, performance monitoring, and alerts, providing a seamless operational experience even in mixed NOS (Network Operating System) environments.
3. What is FMCLI and why was it developed instead of relying on SONiC CLI alone?
FMCLI (Fabric Manager CLI) was developed to overcome the limitations and inconsistencies in SONiC’s native CLI. FMCLI provides a flexible, consistent command-line experience to configure and manage SONiC fabrics efficiently, simplifying orchestration and supporting intent-based configurations across diverse vendor hardware.
4. How does ONES ensure deep telemetry and metric normalization across different SONiC platforms?
ONES uses a dedicated telemetry layer that collects over 200+ critical metrics using gNMI and advanced monitoring beyond RedisDB. It normalizes multi-vendor telemetry data into a unified format, allowing network operators to correlate issues faster, diagnose performance gaps, and ensure proactive decision-making.
5. How does the integration of FTAS with ONES accelerate SONiC pre-deployment validation?
The Fabric Test Automation Suite (FTAS) integrates with ONES to automate validation of SONiC fabrics before deployment. It helps verify multi-vendor configurations, scalability, resiliency, and performance through a library of pre-validated tests, drastically reducing the risk of deployment failures and speeding up production readiness.
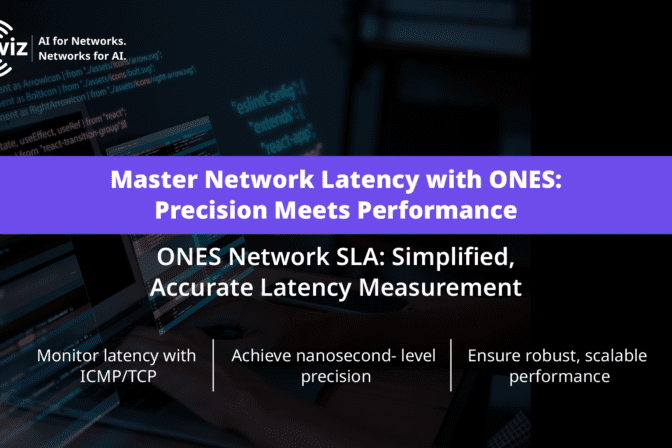
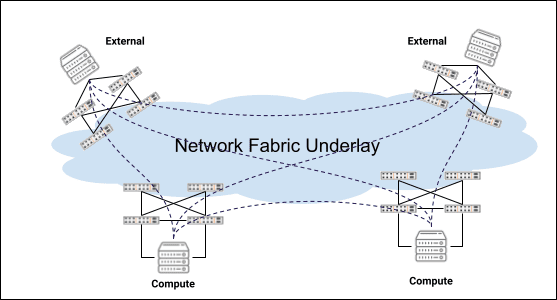
In today’s datacenter landscape, network latency holds significant importance due to its impact on the overall performance, efficiency, and reliability of datacenter operations. Here are key aspects that highlight the significance of network latency in data centers. Low network latency is crucial for ensuring optimal performance of applications hosted in data centers. Users expect fast response times when accessing services and applications, and latency directly influences the perceived responsiveness of these systems. Organizations face various challenges in measuring and optimizing network latency, as this task involves complex considerations related to infrastructure, applications, and user experience. Some common challenges include the complexity of the network infrastructure, dynamic workloads and continuous monitoring feeding to the analysis. This blog introduces you to the backend of ONES network latency measurement component , the core engine responsible for collecting data related to network latency. This component plays a crucial role in providing insights into the performance of a network, helping organizations monitor and optimize their infrastructure. It supports various network protocols, including ICMP (Internet Control Message Protocol), and TCP (Transmission Control Protocol), depending on the need.
Let’s explore the key aspects and functionalities of the backend.
Core Features
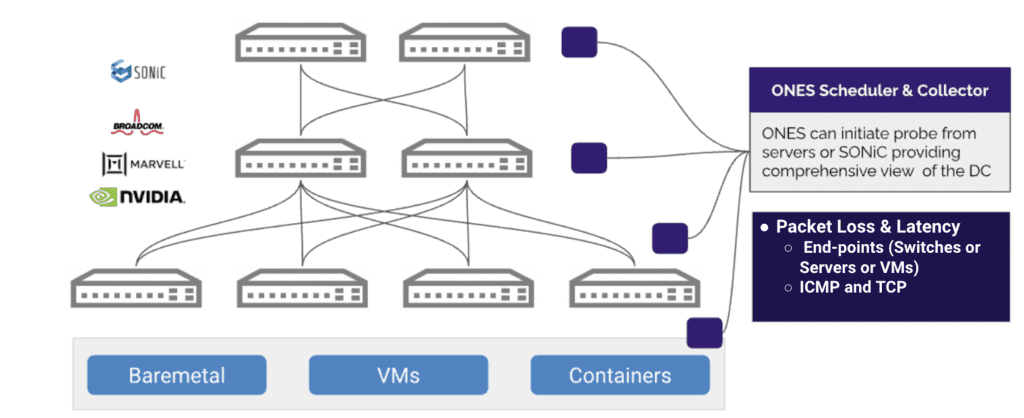
The NWSLA measurement component provides an agent that runs in the SONiC switches as well as servers. This agent exposes an API to the ONES collector eco-system and allows for triggering the latency measurements. Latency to a Destination IP can be measured using either ICMP or TCP. The calculation involves the following parameters
Protocol - ICMP vs TCP
Destination IP
Port (for TCP)
The above diagram explains the same. ONES Collectors controls & facilitates the probes, allowing latency measurements to be performed by the whole ecosystem of endpoints. One of the important features of this agent is its ability to allow the calculations to be calculated periodically. For instance an operator wishes to calculate the latency between point A to point B every 5 minutes. This aids the operator in the following cases
Periodic latency calculations help operators monitor the health of the network. An increase in latency can indicate potential bottlenecks or issues that need optimization.
By measuring latency regularly, operators can verify that the network meets the latency requirements specified in SLAs, maintaining high-quality services for customers and stakeholders.
Regular latency measurements provide a baseline for normal network behavior. Deviations from this baseline can signal potential faults, enabling operators to troubleshoot and resolve issues promptly.
Latency calculations help operators understand how network performance scales with increasing loads. This information is crucial for capacity planning and ensuring the network can handle growing demands.
Periodic latency measurements are essential for monitoring the performance of real-time applications, such as video conferencing or voice-over IP (VoIP), where low latency is critical for a smooth user experience.
To cater to such requirements, ONES allows the operator to schedule the calculation of the latency periodically over specified time intervals. This allows the operators to understand the performance of the networks proactively.
NanoSecond Level Precision
One of the unique features of the ONES infrastructure that calculates this latency is its ability to calculate the latency in terms of nanoseconds. Calculating the latency in terms of nanoseconds offers some unique advantages, in scenarios where extremely precise and rapid measurements are essential perfect for the datacenter networks. It allows
Ultra-Low Latency Requirements: Nanosecond-level measurements cater to applications with ultra-low latency requirements. These applications demand the fastest possible response times for optimal performance.
Real-Time Communication: Applications like telecommunication services and real-time communication tools benefit from nanosecond-level measurements. This precision ensures that communication is nearly instantaneous, enhancing the quality of real-time interactions
Computing: In edge computing environments, where processing occurs closer to the data source, nanosecond-level latency measurements are crucial. This precision helps evaluate the effectiveness of edge deployments in providing rapid responses.
High Throughput Networks: In networks with exceptionally high throughput, nanosecond-level precision is advantageous for accurately assessing the efficiency and performance of the network, especially under extreme loads.
In summary, calculating latency in nanoseconds offers advantages in situations where speed, precision, and real-time responsiveness are paramount.
Decoding Nanosecond Latency Calculation
Precision in nanosecond latency calculation is a sophisticated endeavor. ONES adopts an innovative approach by modeling the network analogous to an optical channel, ensuring a high degree of precision in latency calculation. The methodology involves sending bursts of packets and deriving latency measurements seamlessly, deviating from the conventional approach of correlating request and response times. This eliminates the need to calculate latency per request before initiating subsequent probes. The flexibility of ONES allows for the configuration of parameters to align with specific network requirements.
Scalability & Robustness
The ONES ecosystem excels in delivering exceptional scalability and robustness. The philosophy of ONES is seamlessly reflected in the design of its latency measurement, ensuring scalability and robustness are prioritized. This commitment is affirmed through various validations, including measuring latency under load, the seamless addition of new nodes for calculations, the capacity to handle and sustain a significant number of probes by the agent, built-in fault tolerance features, optimized resource utilization, and consistent operational and longevity behavior.
Use-Cases: Ping-pong Mesh
One of the simple use-case scenarios will be to trigger the measurement across the endpoints of the network. This initiates the latency test from the end points attached to the network ensuring that the packets used to measure latency traverse the network to reach the other endpoint. This will be calculated proactively at a set defined interval allowing to check on the latency periodically. Identifying latency bottlenecks helps optimize resource allocation and maintain high-quality services
Under such use-cases, the measurement of latency plays a vital role in optimizing overall network performance. Low-latency communication directly enhances user experience, aids in capacity planning, facilitates proactive issue resolution, and furnishes valuable data for making informed decisions about network infrastructure.These scenarios can be expanded, including the exploration of latency between the most distant leaf nodes, and so on.
ONES Network SLA - Future Looking
Subsequent releases of ONES provide robust support with advanced features built upon this foundational base. Initially, integration with the ONES UI will be seamless, offering comprehensive cloud integration support. Additionally, support for path tracing and availability metrics will be extended across the system.
In conclusion, the backbone of a network latency measurement tool functions as the core engine responsible for gathering, processing, and evaluating data to gauge the vitality and efficiency of a network. It stands as a pivotal element for organizations aiming to sustain ideal network latency, guaranteeing a smooth and responsive user experience.
Have comments or feedback? Please feel free to get in touch with us For experiencing SONiC, Please try ONES Center https://aviznetworks.com/one-center For detailed case study of SONiC, please refer here
FAQs
1. What is the ONES Network Latency Measurement Backend and how does it work?
The ONES Network Latency Measurement Backend is a core engine that enables high-precision latency monitoring across SONiC switches and servers. It uses agents deployed at endpoints to trigger periodic ICMP or TCP-based probes, providing real-time latency insights critical for monitoring network health and optimizing datacenter performance.
2. How does ONES achieve nanosecond-level precision in latency measurements?
ONES models network latency measurement similar to an optical channel by sending bursts of packets, enabling seamless, ultra-precise latency calculations without the overhead of per-request correlation. This unique approach delivers nanosecond-level accuracy ideal for real-time communication, edge computing, and high-throughput data center networks.
3. What are the benefits of periodic latency measurements in a data center environment?
Periodic latency monitoring helps detect performance bottlenecks early, ensures SLA compliance, identifies real-time communication issues, supports capacity planning, and establishes a baseline for normal network behavior — enabling proactive management and optimized user experience.
4. Can ONES latency measurement scale across large, distributed data center networks?
Yes, the ONES infrastructure is designed for exceptional scalability and robustness. It supports a large number of simultaneous probes, handles high-traffic loads, adds new nodes seamlessly, and maintains consistent accuracy and operational stability even in large, dynamic data center environments.
5. What use cases can be addressed with ONES Network Latency Monitoring?
ONES can be used for real-time latency monitoring between endpoints, identifying bottlenecks across leaf-spine topologies, optimizing RoCE traffic, validating edge computing responsiveness, supporting capacity planning, and proactively detecting network issues ensuring superior performance across modern AI and cloud-driven infrastructures.
The ONES Rule Engine is a sophisticated feature that enhances your network management capabilities by incorporating an integrated alert and notification system. It delivers detailed monitoring metrics and facilitates easy creation of rules at both device and interface levels. The latest update to the ONES Rule Engine has broadened its capabilities to monitor AI-Fabric metrics such as queue counters, PFC, traffic rates, and link and node failures. This enhancement allows administrators to achieve better visibility into network performance, pinpoint potential issues, and proactively maintain optimal conditions for RoCE-based applications and workloads.
Anomaly Detection and Alerting on AI-Fabric
The following AI fabric counters help DCOs identify and prevent network congestion and data loss.
Queue Counters
Packet Transmit Rate: This counter tracks the rate at which packets are transmitted from the RoCE queue. A high transmit rate could indicate potential congestion or oversubscription.
Packet Receive Rate: This counter measures the rate at which packets are received on the RoCE queue. Monitoring this rate can help identify potential bottlenecks or overloaded receivers.
Dropped Packets: This counter tracks the number of packets dropped due to queue overflows or other reasons. Excessive packet drops can severely impact RoCE performance and should be investigated.
ECN Marked Packets: Explicit Congestion Notification (ECN) is a mechanism used by RoCE to signal congestion. Monitoring ECN marked packets can help identify and mitigate congestion before it becomes severe.
Performance Counters
PFC (Priority Flow Control): PFC is a mechanism used by RoCE to pause traffic temporarily to prevent packet loss. Monitoring PFC events can help identify potential congestion hotspots in the network.
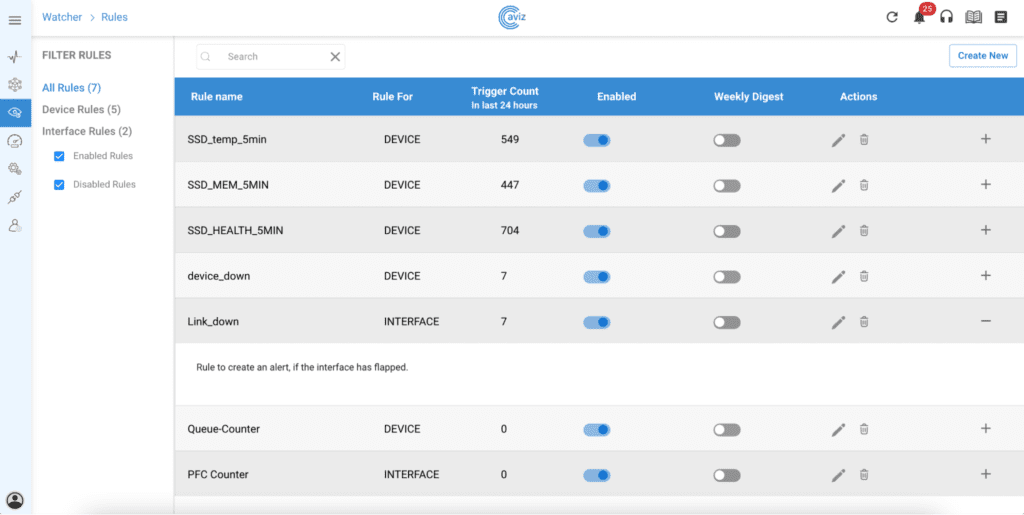
ONES 2.1 Rule Engine for Anomalies & Alerting
PFC Receive and Transmit Counters
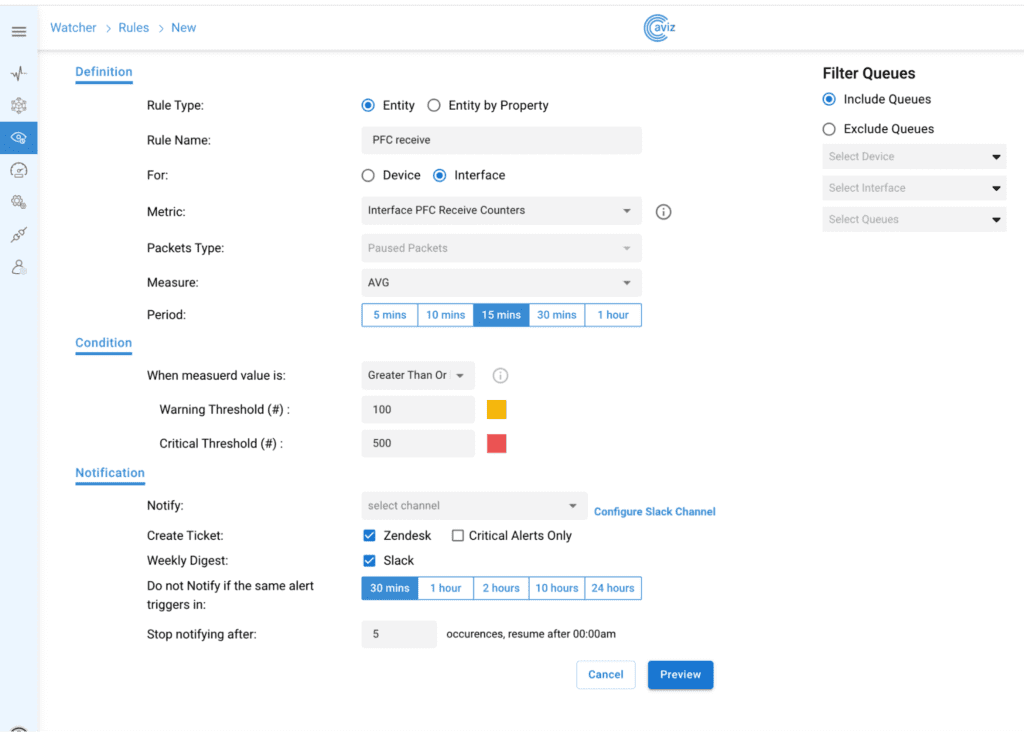
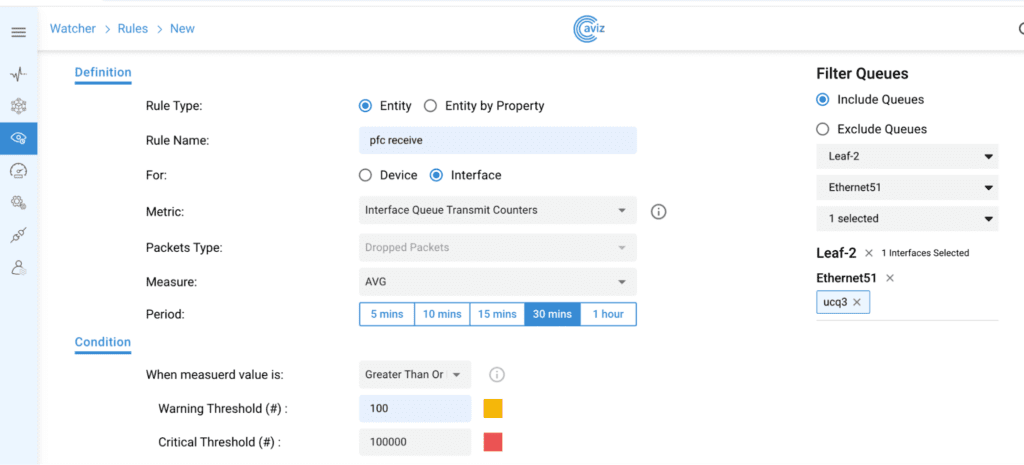
Priority Flow Control (PFC) is a mechanism that prevents frame loss due to congestion. It operates by sending priority pause frames (per traffic class) to the sender when buffer thresholds are exceeded due to congestion. The count of priority pause frames sent/received by the device is available in the PFC counters.With the active monitoring of PFC counters, the ONES rule engine’s can create alerts Data center operators and administrators on potential congestion and hotspots.
Customers have the flexibility to set their desired congestion threshold for alerting using the various attribute available:
Time Interval: 5 min, 10 min, 15 min , 30 min, 1 hr
When conditions are met, the ONES rule engine dispatches alerts through configured channels such as Slack and Zendesk, as well as on the Watcher – Alerts page. These alerts provide essential information about the generated alert, including details on the device, interface, and queue.
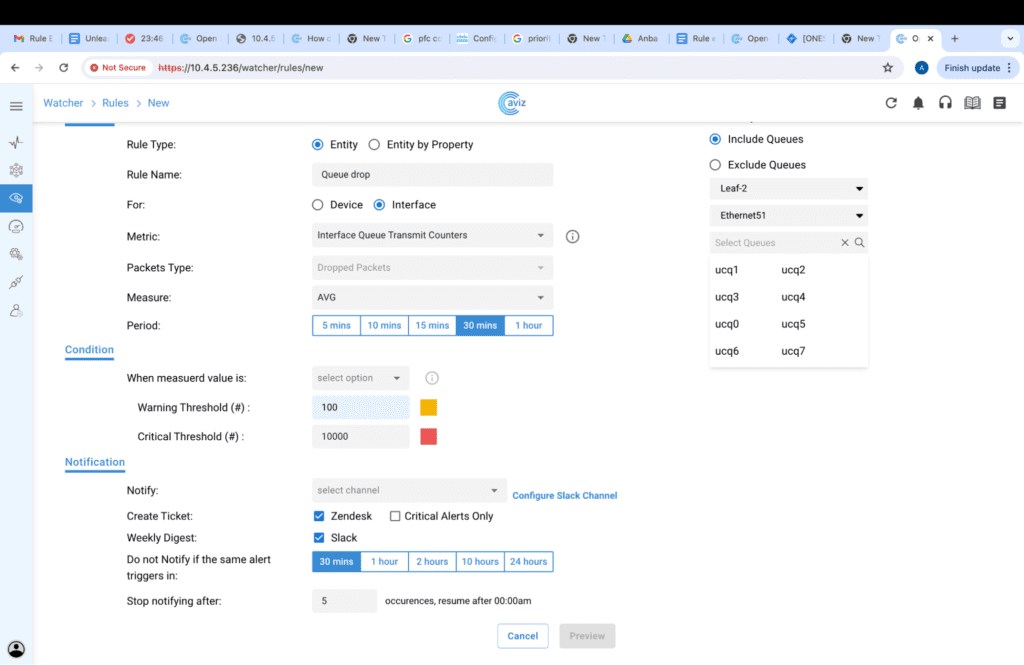
Queue Drop Counters:
When setting up a network for lossless applications such as RoCE, it’s crucial to also monitor flows that may become lossy. Egress queue drop counters are vital for identifying congestion and traffic drops on outbound ports. Analyzing these egress queue drops helps customers troubleshoot network congestion and resolve performance issues. Furthermore, queue drop counters can be activated at the device level, allowing for an overall assessment of queue drops across all queues on every interface of a device.
Figure 2: Rule for Queue drops
Figure 3: Filter options for interface Queue Drop counters rule
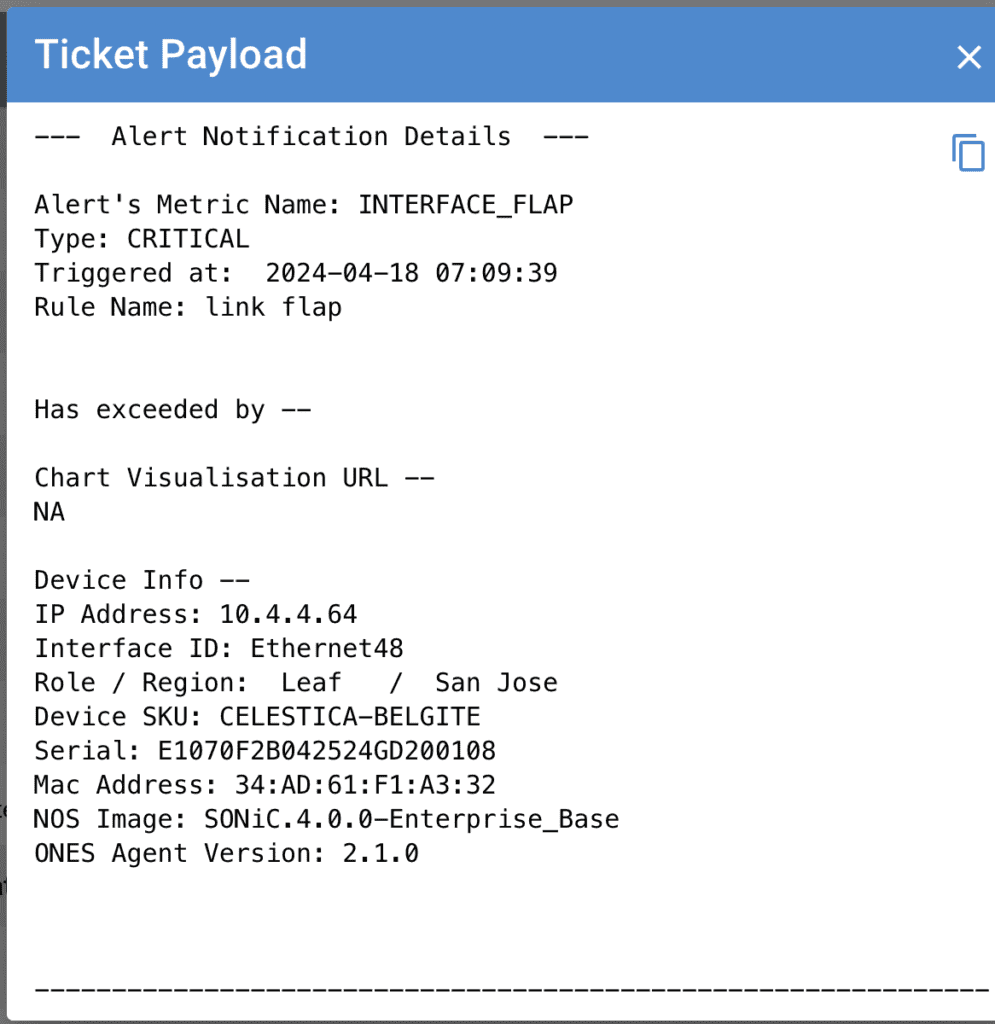
Failure Detection: Link Flap
“Link Failure” is another critical metric which needs to be monitored in AI-Fabric. Bad links due to improper cabling and transceivers can significantly affect the lossless requirement for RoCE traffic. It is critical to alert and take corrective action to avoid traffic loss and performance degradation. Corrective actions could include replacing bad optics or adjust the control plane policies to re-route the traffic towards a better path. ONES rule engine performs the continuous monitoring of links over a specific interval and automatically creates alerts with necessary payload including the device, Optics information, details, device location and layer etc. This can help the DCOs have all the necessary data to take the corrective action.
Figure 4: Alert payload – link down
FAQs
1. What is the ONES Rule Engine and how does it enhance AI-Fabric monitoring?
The ONES Rule Engine is an integrated alert and notification system that provides detailed monitoring at the device and interface levels. It tracks critical AI-Fabric metrics like queue counters, PFC events, traffic rates, and link failures, enabling proactive detection of congestion, anomalies, and potential RoCE performance issues.
2. Which AI-Fabric metrics can be monitored using the ONES Rule Engine?
ONES Rule Engine monitors key AI-Fabric counters such as packet transmit and receive rates, dropped packets, ECN-marked packets, PFC transmit/receive counters, queue drop rates, and link flap failures providing complete visibility into traffic performance, congestion points, and hardware health.
3. How does ONES Rule Engine help prevent RoCE traffic congestion and packet loss?
By continuously tracking PFC events, queue drops, and ECN-marked packets, the ONES Rule Engine can generate real-time alerts when congestion thresholds are breached. This allows data center operators to take immediate corrective actions, ensuring lossless traffic flow essential for RoCE workloads.
4. Can the ONES Rule Engine send real-time alerts to external collaboration tools?
Yes, when predefined conditions are met, ONES Rule Engine can dispatch real-time alerts through channels like Slack, Zendesk, and its internal Watcher-Alerts page. Each alert includes critical details about the device, queue, and interface to expedite troubleshooting and resolution.
5. How does the ONES Rule Engine detect and respond to link flap failures in AI fabrics?
ONES Rule Engine continuously monitors links for instability or flaps, especially critical in RoCE-based fabrics. Upon detecting issues, it automatically generates alerts with full payload details (device, optics, location, layer), enabling rapid corrective actions like optical replacements or traffic rerouting.
We’re thrilled to unveil ONES 2.1, a revolutionary network management and operations solution that redefines the benchmarks for Visibility, Orchestration, and Support. This release marks a monumental stride in our unwavering dedication to pushing the boundaries of network management capabilities and orchestration. Packed with cutting-edge features, ONES 2.1 introduces a groundbreaking ONE Data Lake which integrates with AWS S3 and Splunk, addition of multi-vendor NOS (NXOS, EOS, Cumulus) visibility, extended platform metrics (SSD Health, Device Failure detection, etc and enhanced anomaly and alerting mechanism for AI-Fabric.
Prepare to embark on a journey where innovation intersects with excellence, as ONES 2.1 empowers your network endeavors with unparalleled sophistication and efficiency. It’s more than just a tool; it’s a paradigm-shifting innovation meticulously designed to enhance your network experience to levels never seen before.
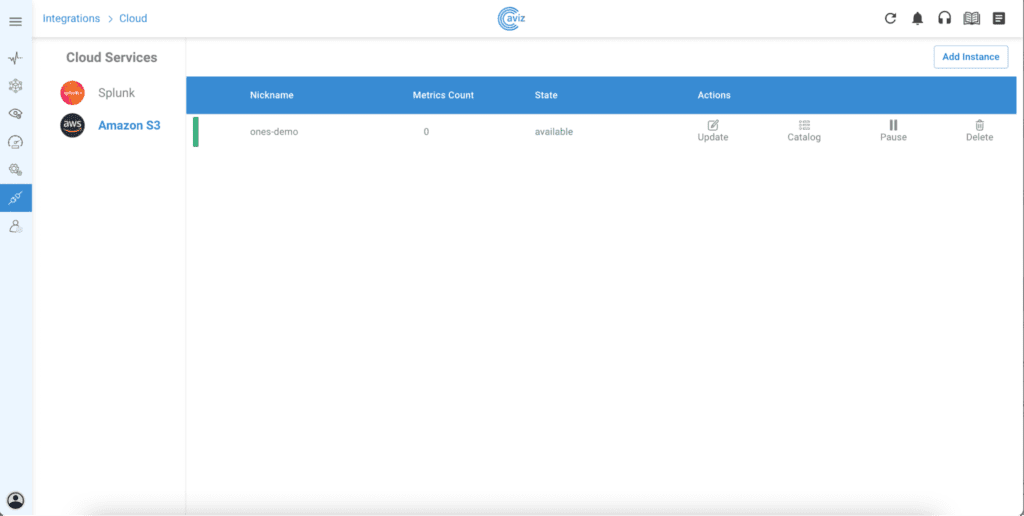
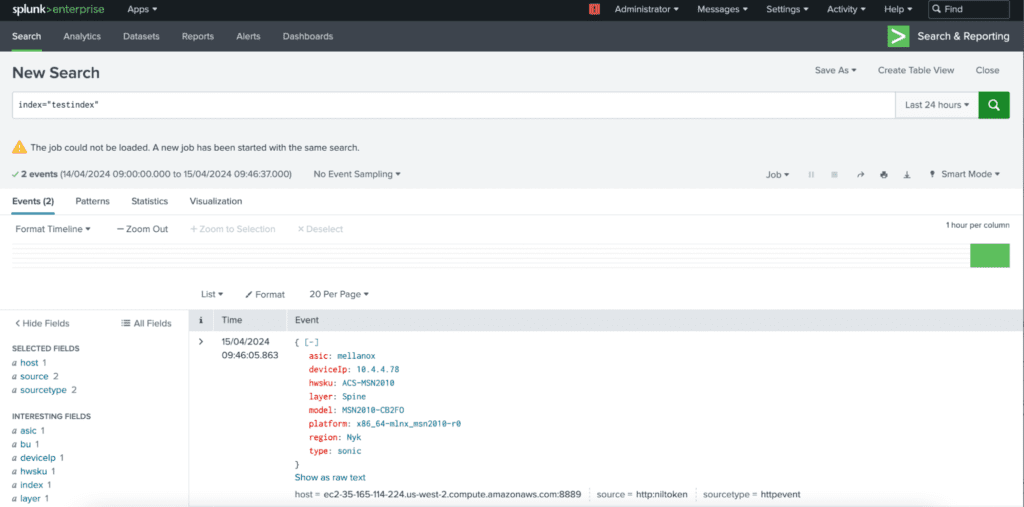
ONE-DL with AWS S3 and Splunk:
In the 2.1 release of ONES, a cloud data lake has been introduced, featuring integration with AWS S3 and Splunk. This integration enables seamless migration of ONES telemetry data to the customer defined storage nodes hosted either in Cloud or On-Prem, paving the way for custom data analytics use cases. By leveraging cloud infrastructure and analytics tools, ONES users can unlock deeper insights from their network data, enhancing decision-making and operational efficiency.
Multi-NOS Telemetry
ONES now supports Multi-NOS network telemetry including Cisco NX-OS, Arista EOS and Cumulus NOS. This addition expands ONES capabilities to manage networks with diverse non-SONiC Network Operating Systems (NOS), establishing ONES as a versatile multi-vendor platform tool. Users can now benefit from centralized network management across various vendor environments, enhancing efficiency and flexibility in network operations.
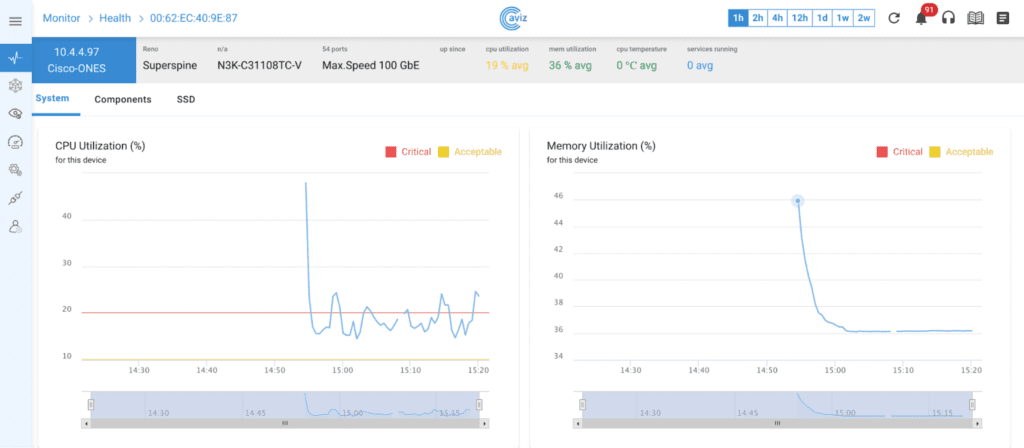
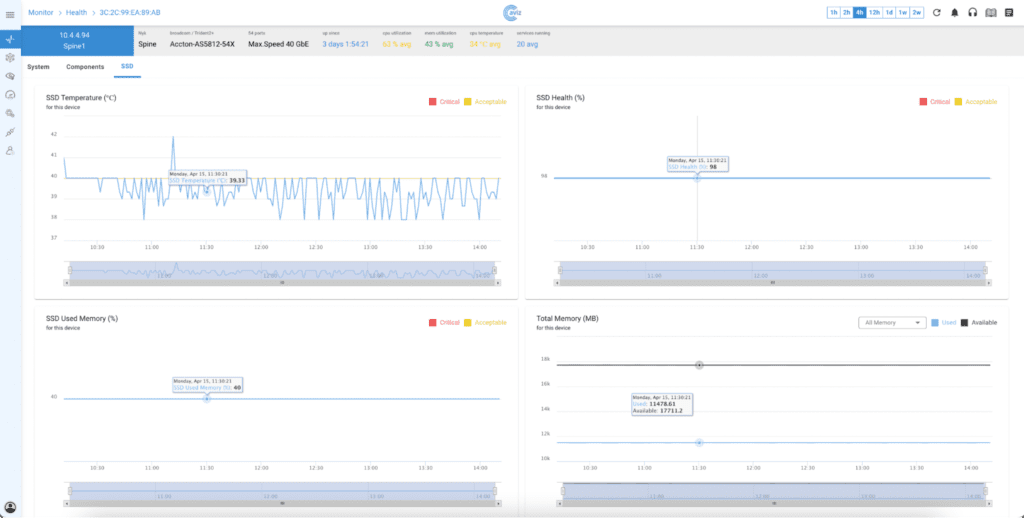
Advanced Telemetry for SONiC Support
SSD Health: SSDs are considered reliable, with a mean time to failure of one to 1.5 million hours indicating a low annual failure rate. Despite this, they are often the most frequently replaced component in large-scale IT infrastructures and data centers, where many failures are attributed to SSD malfunctions. It is crucial to use comprehensive monitoring to detect failing SSDs, ensuring data availability and preventing data loss.
AI-Fabric Anomaly Detection & Alerting: RoCE-related metrics have been incorporated into our rule engine service, enhancing the ability of our support team to automatically troubleshoot and alert for anomalies in the network fabric used by GPUs. This integration includes interface, queue, and PFC counters, in addition to existing metrics for detecting failures such as link and device failures. These enhancements make ONES an all-encompassing tool for our support team to diagnose and optimize AI-Fabric deployments.
Enhanced Orchestration Capabilities
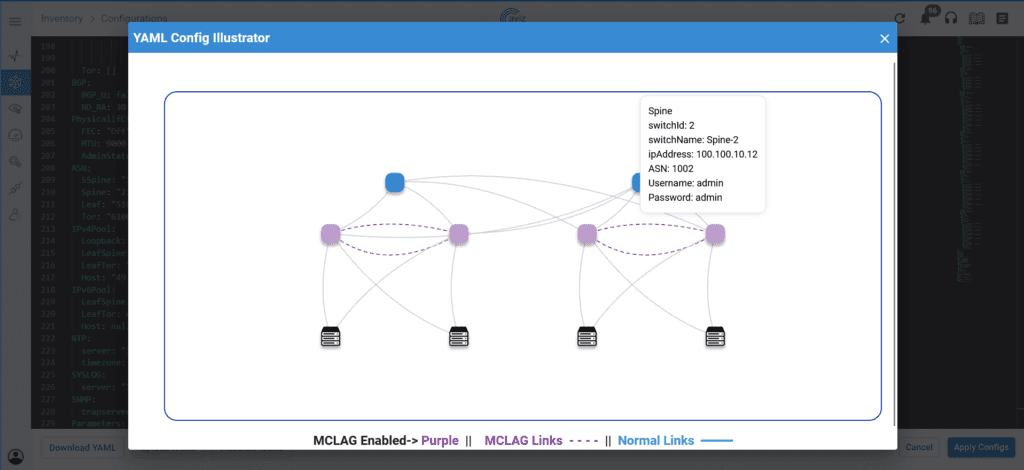
Network Config Illustrator: The Network Config Illustrator is a specialized tool crafted to generate visual representations of network topologies using input configuration files. Its core objective is to offer users a tangible depiction of their network structure, offering a glimpse into how the real network diagram might appear. This aids users in comprehending and analyzing their network setups more effectively.
Over 70+ Pre-Validated Templates: Pre-validated templates, meticulously crafted to simplify network management across various use cases. These templates are designed to empower network professionals with ready-to-use configurations, reducing deployment time, minimizing errors, and enhancing overall efficiency. Access the templates here: Aviz Networks GitHub – YAML Templates 2.1
Improvised Fabric Manager CLI: FMCLI now offers extended support for multi-vendor environments, accommodating both x86 and ARM devices. Multi-session Support, ensuring that each session maintains its integrity avoiding accidental overrides and empowers users to work confidently, knowing that their configurations are protected and their workflow remains uninterrupted.
Discover the unparalleled capabilities of ONES 2.1 tailored for SONiC, featuring a suite of innovative functionalities and enhanced user interface. Revolutionize your network orchestration and management with these cutting-edge advancements!
Embark on your path to seamless network monitoring and orchestration today.
FAQs
1. What are the key new features introduced in ONES 2.1 for network observability and management?
ONES 2.1 introduces major enhancements, including ONE Data Lake integration with AWS S3 and Splunk, multi-NOS telemetry for NX-OS, EOS, and Cumulus, SSD health monitoring for SONiC platforms, advanced AI-Fabric anomaly detection, and extended orchestration capabilities with visual network topology tools and pre-validated configuration templates.
2. How does the ONE Data Lake integration with AWS S3 and Splunk benefit network operations?
The ONE Data Lake integration allows ONES telemetry data to be stored on AWS S3 or Splunk platforms, enabling scalable storage, advanced analytics, historical trend analysis, and customized insights for predictive network management, enhancing operational decision-making and proactive maintenance.
3. What is the significance of multi-NOS telemetry support in ONES 2.1?
ONES 2.1’s multi-NOS telemetry extends network observability beyond SONiC to include Cisco NX-OS, Arista EOS, and Cumulus Linux. This empowers enterprises to achieve unified visibility and centralized management across diverse multi-vendor environments, reducing operational silos and boosting cross-platform efficiency.
4. How does ONES 2.1 enhance AI-Fabric deployments with anomaly detection and alerting?
ONES 2.1 integrates RoCE metrics into its rule engine, enabling automatic detection of fabric-related anomalies such as congestion, link failures, and device malfunctions. This advanced alerting mechanism helps optimize GPU-based AI fabrics, improving reliability, performance, and issue resolution times.
5. What new orchestration tools are available in ONES 2.1 to simplify network management?
ONES 2.1 offers a Network Config Illustrator for visualizing network topologies, 70+ pre-validated configuration templates for rapid deployment, and an improved Fabric Manager CLI (FMCLI) with multi-session and multi-vendor support streamlining both operational workflows and configuration management across diverse network setups.
Introducing ONES 2.0: Advanced Alerting Integrated with Slack & Zendesk
In the ever-evolving landscape of network operations (NetOps), staying ahead of potential issues and ensuring seamless functionality is imperative. We’re thrilled to unveil a groundbreaking enhancement to our NetOps product ONES – an intelligent alerting and notification system that seamlessly integrates with Slack and Zendesk. This new feature harnesses the power of an Advanced Rule Engine to deliver proactive alerts and streamline incident management, revolutionizing the way teams handle network complexities.
How Does ONES Intelligent Integration Simplify Network Infrastructure Management?
NetOps professionals are consistently challenged with the task of monitoring and managing intricate network infrastructures. The integration of an Intelligent Rule Engine within our platform marks a significant leap forward in simplifying this process. By leveraging sophisticated algorithms and machine learning capabilities, this enhancement enables the automated detection of anomalies and potential issues within the network.
ONES-based intelligent rule engine goes beyond simple threshold-based alerting to analyze vast amounts of network data and identify patterns that indicate potential issues. This intelligent approach to alerting helps reduce noise and ensures that network administrators are only notified about the most critical events, freeing up their time to focus on resolving issues rather than sorting through a barrage of irrelevant alerts.
ONES allows users to provide webhooks to integrate Slack Messaging and Zendesk Ticketing for Rule Engine
Slack Channel Name and URLZendesk Ticketing URL and API Token
What Makes Proactive Alerting Essential for Swift Action?
The key highlight of this integration is its ability to generate real-time alerts based on predefined conditions and thresholds. Whether it’s a sudden surge in network traffic, a device experiencing performance degradation, platform health, resource utilization, link changes or any other critical event, the system can instantly identify, categorize, and trigger alerts.
These alerts are not merely generic notifications; they’re intelligently crafted to provide actionable insights. This means that your team receives specific and contextual information regarding the nature of the issue, its severity, and recommended actions, empowering them to take swift, informed measures.
How can Slack and Zendesk integration enhance incident management?
The integration extends beyond generating alerts; it seamlessly connects with popular collaboration tools like Slack and ticketing systems like Zendesk. Through these integrations, alerts are directly pushed to designated channels or individuals on Slack, ensuring immediate visibility across relevant teams.
Moreover, the seamless linkage with Zendesk facilitates automatic ticket creation or updates when an alert is triggered. This streamlines incident management workflows, allowing teams to initiate prompt responses and maintain a comprehensive log of network-related incidents within their existing ticketing system.
Rules: Creating a New Rule
As part of supportability functions. ONES also offers users with ease to
generate tech support dumps and syslogs for endpoints
access to switch via Console and SSH
Login Credentials and Syslogs CountLogin Prompt
Key Benefits of Integrating ONES Rule Engine with Slack and Zendesk
Not every situation can be addressed with a single solution. Recognizing this, our intelligent alerting system offers extensive customization options. Users can define and fine-tune rules according to their network’s specific requirements, adjusting thresholds, conditions, and notification channels as needed. This scalability ensures that the system adapts and grows with your network infrastructure.
Key Benefits:
Reduced alert fatigue: By intelligently filtering out irrelevant alerts, you can minimize alert fatigue and ensure that network administrators are only notified about critical events.
Faster response times: With critical alerts delivered directly to Slack and Zendesk, your team can respond to network issues more quickly and efficiently.
Improved collaboration: Seamless integration with collaboration platforms fosters better communication and collaboration among team members, ensuring that everyone is kept informed and can contribute to resolving issues effectively.
Weekly Digest: Weekly digest gives an apparent summary of all the logs generated by Rule Engine, it provides summarized details including Metric Name, the type of the threshold, Device information with MAC Address and the device IPs, so the NetOps team can easily get a clear idea what actually triggered throughout the week
The Power of Innovative Integration: Enhancing Efficiency and Reliability in NetOps
With this innovative integration, NetOps teams can bid farewell to reactive firefighting and embrace a proactive approach to network management. The intelligent rule engine significantly reduces the mean time to detect (MTTD) and mean time to respond (MTTR), enhancing operational efficiency and bolstering network reliability.
Conclusion
In an era where network stability drives business success, our intelligent alerting system, ONES 2.0, represents a paradigm shift in NetOps. The integration of an advanced rule engine with Slack and Zendesk empowers proactive network management, ensuring smooth operations and swift incident resolution.
Step into the future of NetOps with our enhanced ONES 2.0, unlocking elevated efficiency and reliability in network infrastructure management. Stay ahead, act decisively, and elevate your network operations with our intelligent alerting integration.
Our alert and notification system extends beyond Slack and Zendesk, applicable to any messaging app or ticketing system, ensuring you stay on top of priorities.
To witness how ONES 2.0 can revolutionize your NetOps, schedule a demo or Contact us today for a firsthand experience!
As technology advances, several trends are emerging in the application of Generative AI for networking, paving the way for more intelligent and adaptive network infrastructures. Some notable trends include Predictive Network Analytics, AI-Enhanced QOS, Network Resource Optimization, Anomaly Detection, Simulation of Realistic Network Environments, Autonomous Network Operations. RoCE (RDMA over Converged Ethernet) can address several challenges posed to networking devices in the context of Generative AI.
This serves as the foundation for the AI fabric due its improved model training speed, optimized and reliable data movement and its compatibility with Ethernet networks. Effective monitoring of RoCE traffic becomes instrumental in maintaining seamless operations.
Another important technique, proactive congestion management is crucial for maintaining optimal performance, reliability, and efficiency. AI workloads often involve the exchange of large datasets and real-time communication between nodes. Network congestion can lead to performance degradation, slowing down data transfers and compromising the responsiveness of AI applications. By identifying and addressing potential congestion points before they impact performance, proactive congestion management helps prevent degradation in the performance of generative AI tasks. This ensures that AI models can operate at optimal speeds, meeting the demands of real-time or near-real-time processing needs.
AI Fabric Insight
ONES – Crafted for SONiC based AI Fabric
In the ever-evolving realm of generative AI networks, where the need for high-performance and low-latency communication takes center stage, ONES 2.0 is set to redefine network optimization. This latest release presents a state-of-the-art solution meticulously crafted to streamline network operations. ONES seamlessly incorporates advanced features such as Priority Flow Control (PFC) counters for RoCE support, and proactive congestion management based on port and per port queue utilization details. ONES supports the collection of the metrics aiding the SONiC-Fabrics with AI across multiple vendor platforms offering excellent scalability support and powerhouses the data collection process. It also seamlessly integrates with the ONES ecosystem – orchestration, visibility, and support for third-party APIs including REST and Prometheus – offering the go-to solution for streamlined management, comprehensive monitoring, and flexible interoperability in complex network environments.
ONES Unveiling SONiC AI Fabrics & RoCE: A Visual Exploration
ONES collects a set of valuable metrics that is instrumental in monitoring RoCE (RDMA over Converged Ethernet) as it provides insights into the flow control mechanisms and helps ensure the efficient and reliable communication of RoCE-enabled networks.
How Does Metric Collection Empower AI Fabrics to Tackle Challenges?
Traffic Prioritization: These metrics reveal how different types of traffic are prioritized in the network. In RoCE, where low-latency communication is crucial, the ability to prioritize traffic ensures that RDMA operations and other critical data transmissions are given precedence.
Congestion Management: Help in monitoring and managing network congestion. RoCE networks can experience congestion, and PFC allows for the pause of non-critical traffic during congestion, preventing packet loss and ensuring the smooth operation of RDMA communication.
Powering AI with PFC and Rx/Tx Watermark counters
Quality of Service (QoS): RoCE networks often have specific QoS requirements. These metrics provide data on how well the network adheres to these QoS policies. Monitoring allows network administrators to ensure that RoCE traffic receives the necessary level of service, minimizing latency and optimizing performance.
Identifying Bottlenecks: ONES can highlight potential bottlenecks in the network. By monitoring the pause frames and PFC counters, administrators can identify areas of congestion or network inefficiencies that may impact RoCE performance.
Real-time Monitoring: Real-time monitoring done by ONES allows for immediate responsiveness to changes in network conditions. In RoCE environments, where rapid data transfers are common, timely identification and resolution of congestion issues contribute to maintaining low latency and high throughput.
Performance Optimization: Understanding these metrics enables administrators to optimize the performance of RoCE networks. By analyzing the data, adjustments can be made to network configurations, traffic prioritization, or resource allocation to enhance overall RoCE performance.
Capacity Planning: ONES metrics contribute to capacity planning by providing insights into how well the network can handle the current load and whether there is room for expansion. This is crucial for scaling RoCE networks to accommodate growing demands.
Figure 1: Topology Overview of RoCE Traffic
In the RoCE Traffic Topology GUI view, the flow unfolds dynamically, revealing the interconnected pathways of RDMA over Converged Ethernet (RoCE) traffic. Nodes representing devices engaged in RoCE communication are linked by lines indicating the data exchange routes. The graphical representation allows for an intuitive understanding of the network’s structure, emphasizing the direct, low-latency pathways characteristic of RoCE
Figure 2: RoCE Enabled Interfaces
In the graphical user interface (Figure 2), a visual representation unfolds, showcasing the dynamic network landscape with PFC enabled interfaces. These interfaces, depicted in the intuitive display, highlight the integration of RDMA over Converged Ethernet (RoCE) capabilities. The interfaces identified by a blue dot have the capability to transport RoCE traffic.
Figure 3 depicts various provisions facilitating RoCE support on a device. In this case, the device is handling L3 lossless traffic on queues 3 and 4 of interface number 51.
Figure 3: QOS Configuration
Figure 4 below in ONES depicts the distribution of RoCE traffic alongside regular traffic on the interface along with the seamless transmission of lossless data even in congested conditions, revealing the count of pause frames sent/received by the device.
Figure 4: RoCE Traffic Segregation & PFC Counters
Queue drop counters play a pivotal role in AI Fabrics, offering crucial insights into the network’s performance and reliability. These counters specifically track instances where packets are dropped within the queuing system, providing valuable data for monitoring and optimization
Figure 5: QoS Drop Counters
Conclusion
Based on the presented GUI snapshots, it’s evident that ONES offers a captivating visual experience, showcasing intricately designed software crafted explicitly for the AI Fabric on the SONiC platform. ONES doesn’t just fulfill the requirements of contemporary networking; it also enhances user interaction through intuitive visualization and advanced features. This platform signifies an innovative approach to orchestrating and visualizing networks across multiple vendors, delivering a customized solution for addressing the intricate nature of AI Fabric on the SONiC platform.
What’s next in store for our forthcoming blog series, where we’ll extensively explore these informative topics:
Detailed security compliance with ONES
In-depth analysis regarding the measurement of NWSLA
1. What is RoCE and why is it important for AI fabric networks?
RoCE (RDMA over Converged Ethernet) is a networking technology that enables high-throughput, low-latency communication by allowing direct memory access over Ethernet networks. It is crucial for AI fabric networks because it improves model training speeds, supports efficient data movement, and minimizes latency – all essential for real-time or near-real-time AI workloads.
2. How does ONES 2.0 enhance RoCE traffic monitoring in SONiC-based AI fabrics?
ONES 2.0 enhances RoCE traffic monitoring by collecting critical metrics like PFC counters, Rx/Tx watermarks, and QoS drop counters. It enables real-time visibility into traffic prioritization, congestion points, and queue utilization, helping administrators proactively optimize performance, ensure lossless data flow, and maintain low-latency communication across AI workloads.
3. What role does proactive congestion management play in AI workload performance?
Proactive congestion management helps identify and mitigate potential network bottlenecks before they impact performance. In AI workloads involving large datasets and real-time communication, this prevents degradation in model training or inference tasks, ensuring optimal speeds, reliability, and efficient resource utilization.
4. How does ONES support multi-vendor SONiC-based AI fabrics?
ONES 2.0 supports multi-vendor SONiC fabrics by normalizing telemetry metrics and collecting RoCE-related data across various hardware platforms. It integrates with orchestration and third-party APIs (REST, Prometheus), offering centralized visibility, streamlined configuration, and seamless monitoring in diverse AI network environments.
5. What are the key visualization features of ONES for RoCE traffic analysis?
ONES provides an intuitive GUI for visualizing RoCE traffic flow across nodes, interface-level traffic segregation, QoS configuration, and pause frame statistics. Features like PFC counters, lossless traffic mapping, and queue drop insights help network operators understand and troubleshoot AI fabric performance at a granular level.
6. How does ONES help prioritize critical traffic in RoCE-enabled AI environments?
ONES captures real-time prioritization metrics and visualizes queue behaviors. This ensures RDMA operations maintain low latency, even under high data loads—keeping AI training and inference tasks efficient and stable.
7. Can ONES assist with capacity planning in high-growth AI workloads?
Yes. ONES provides:
Historical and live bandwidth utilization
Queue drop trends
Device saturation insights These help teams forecast demand, adjust configurations, and scale SONiC-based AI fabrics proactively.
8. What makes ONES uniquely suited for managing lossless Ethernet in AI fabrics?
ONES offers detailed visualization of:
Pause frames
PFC-enabled interfaces
L3 lossless queue mapping These tools are vital for ensuring zero packet loss in RoCE environments where retransmissions can cripple AI performance.
9. How does ONES integrate with broader observability and automation ecosystems?
ONES connects seamlessly to third-party systems through REST APIs and Prometheus exporters. This enables teams to correlate RoCE telemetry with application metrics and wider infrastructure data, enriching end-to-end observability.
10. What kind of operational teams benefit most from ONES in AI-driven networks?
NetOps, DevOps, and AI infrastructure teams all gain from ONES’s unified telemetry, real-time dashboards, and multi-vendor abstraction—helping them resolve issues faster and align network behavior with AI performance targets.
ONES (Open Networking Enterprise Suite) stands as a robust network management and supportability solution explicitly designed to tackle the distinctive challenges associated with transitioning to SONiC, an open-source Networking Operating System. Our comprehensive suite serves as a multifaceted Network Orchestration, Visibility, and Assurance platform catering to the complexities of operating multi-vendor and multi-NOS Network Infrastructure.
ONES, initially conceived as a comprehensive solution tailored for the challenges of SONiC migration, has evolved significantly. With the emergence of ONES 2.0, a remarkable milestone is achieved.
Aviz ONES 2.0 release emerges as a beacon, making a significant milestone in becoming a genuine multi-vendor SONiC Deployments, operations and AI-Fabric platform.
6 Key Features that Make Aviz ONES 2.0 a Game Changer:
1. Deep Insights with Enhanced Observability:
Advanced Topology View: Gain insights into underlay, overlay, and RoCE traffic Visibility in AI Fabric with an advanced topology view.
Detailed Metrics: Access detailed Protocols, Health and Capacity metrics presented with time series graphs for enhanced visibility.
Comprehensive Pages: Navigate through enriched pages for Inventory, Analytics, and Software, ensuring a holistic network view.
Expanded Metrics: Unlock additional metrics for devices and interfaces, enhancing analytical capabilities.
Quick Access: Swiftly connect with devices through an SSH button in the interface Down Widget.
Firmware Insights: Gain deeper insights with a Firmware details widget embedded in the Software page.
2. Rule Engine & Integrations:
Watcher Rules and Alerts: Implement Watcher Rules for devices and interfaces, coupled with configurable metrics.
Collaborative Integration: Strengthen collaboration with Zendesk and Slack integrations, ensuring seamless notifications.
3. Enhanced Compliance & Device Management:
Efficient Device Management: Streamline device management with syslog extraction, Console access, and Non-SONiC device controls.
Firmware Focus: Access comprehensive firmware information directly in the Device details, enhancing inventory management.
Data Handling: Export or download inventory with ease, simplifying data management.
4. Orchestration:
YAML Configuration Templates: Simplify configuration with YAML templates supporting features like BGP, L2/L3 MC-LAG, EVPN MultiHoming, and more.
Config Updates: Incremental updates for L2VNI/L3VNI configurations, ensuring efficiency in managing network changes.
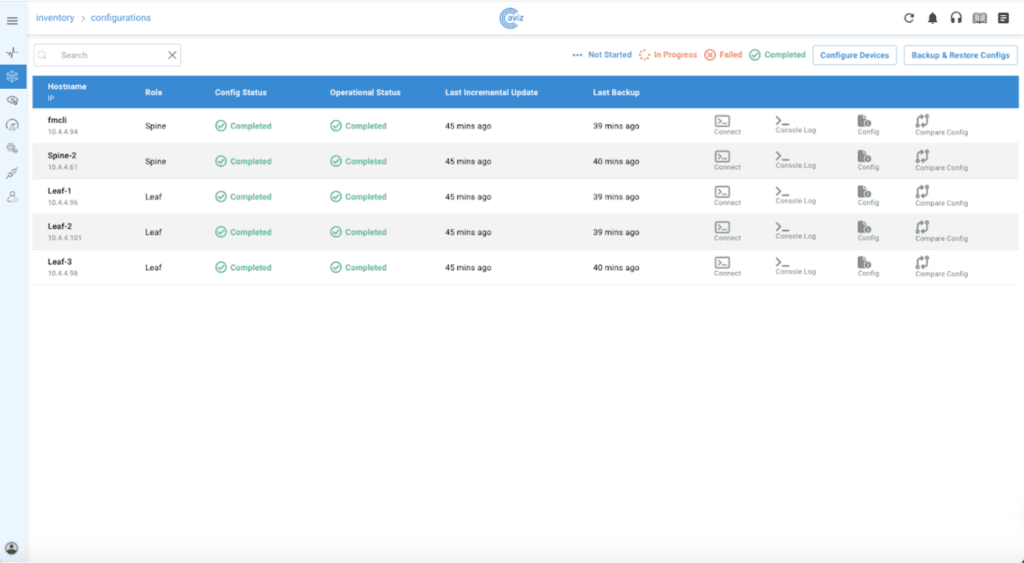
Backup and Restore: Enjoy enhanced backup and restore options via a user-friendly UI, ensuring network stability.
5. Network SLA:
Performance Monitoring: Ensure optimal network performance with CLI Backend support for Packet Loss and Latency metrics.
Endpoint Flexibility: Measure performance between any two end-points using ICMP or TCP, providing flexibility in performance monitoring.
Aviz ONES 2.0 signifies a quantum leap in SONiC supportability, offering advanced monitoring, rule-based alerts, orchestrated configuration updates, and NW SLA monitoring with enhanced UI. Embrace the future of networking with Aviz ONES 2.0 – where innovation meets reliability.
Keep an eye on this space for our upcoming blog series covering these insightful topics:
ONES 2.0 Release features: Complete guide
Rulengine, Alerts, and Notifications
RoCE Traffic Visibility in AI Fabric
Detailed security compliance with ONES
In-depth analysis regarding the measurement of NWSLA
Contact us for personalized guidance and tailored solutions to optimize your SONiC experience. Our team is here to assist you in navigating the complexities, answering your queries, and exploring the best SONiC solutions suited for your unique requirements.
FAQs
1. What are the key enhancements in Aviz ONES 2.0 for multi-vendor SONiC deployments?
Aviz ONES 2.0 introduces deep observability, rule-based automation, enhanced compliance features, and advanced orchestration tools to simplify SONiC operations across multi-vendor environments. Key improvements include:
Advanced Topology View for underlay, overlay, and RoCE traffic visibility.
Expanded device and interface metrics with time-series graphs.
Watcher Rules & Alerts for proactive network monitoring.
YAML-based orchestration for seamless configuration management (BGP, EVPN MultiHoming, etc.).
Enhanced security & compliance with RBAC, LDAP integration, and mutual TLS.
These features make ONES 2.0 a comprehensive AI-Fabric and SONiC operations platform for managing complex networking environments.
2. How does ONES 2.0 improve observability and network insights for AI-driven fabrics?
ONES 2.0 provides a deep observability framework that enables real-time insights into multi-vendor SONiC networks. Enhancements include:
Detailed protocol health and capacity metrics displayed in a structured UI.
Firmware insights widget for software visibility.
Expanded inventory, analytics, and software pages for a holistic network view.
SSH quick-access button for seamless device troubleshooting.
These enhancements enable network teams to gain complete visibility into SONiC-based infrastructures, ensuring optimal performance and proactive issue resolution.
3. How does Aviz ONES 2.0 ensure compliance and security in SONiC-based networks?
ONES 2.0 introduces robust compliance and security measures to ensure a safe and controlled SONiC environment:
Regular security scans to identify vulnerabilities.
Comprehensive RBAC (Role-Based Access Control) for precise user management.
LDAP integration & mutual TLS certificates for secure authentication.
Syslog extraction and centralized device management for compliance auditing.
By integrating these features, ONES 2.0 ensures that organizations can deploy SONiC securely while meeting stringent compliance standards.
4. What orchestration features does ONES 2.0 offer for SONiC network automation?
YAML-based configuration templates supporting BGP, MC-LAG, EVPN MultiHoming, and more.
Incremental updates for L2VNI/L3VNI configurations, ensuring efficient changes.
Backup & restore capabilities via UI, minimizing downtime and improving operational efficiency.
These features help organizations automate SONiC configurations at scale, reducing manual efforts and accelerating deployments.
5. How does ONES 2.0 help optimize network SLA monitoring and performance tracking?
ONES 2.0 enhances SLA tracking and network performance monitoring through:
Packet loss and latency measurement tools to ensure network health.
ICMP and TCP-based endpoint flexibility, allowing performance testing between any two network points.
CLI backend support for real-time monitoring and troubleshooting.
6. How does ONES 2.0 improve RoCE traffic visibility in AI data center fabrics?
ONES 2.0 delivers enhanced topology views and underlay/overlay mapping that includes RoCE traffic paths. This is critical for AI workloads that need consistent low-latency, lossless Ethernet. Real-time protocol health and congestion insights help operators optimize GPU networking at scale.
7. What kind of alerts and notifications can I configure with ONES 2.0?
ONES 2.0’s Watcher Rules engine allows teams to:
Set threshold-based alerts on device metrics and interface health
Monitor protocol states
Receive proactive notifications via Slack or Zendesk This ensures the right teams respond quickly to any network anomalies.
8. Is ONES 2.0 suitable for environments running both SONiC and non-SONiC devices?
Yes. ONES 2.0 supports hybrid networks with SONiC and non-SONiC devices. Its extended device management capabilities—like syslog extraction, console access, and firmware tracking—provide full observability across diverse vendor environments.
9. How does ONES 2.0 reduce the operational burden for NetOps teams?
By offering YAML-based orchestration, easy UI-driven backups and restores, and incremental configuration updates, ONES 2.0 streamlines day-to-day tasks. NetOps teams deploy changes faster, validate configurations in real time, and maintain SLA compliance with less manual effort.
10. What makes ONES 2.0 enterprise-ready from a security and compliance perspective?
ONES 2.0 includes enterprise-grade security features like:
RBAC for precise user access control
LDAP integration for secure authentication
Mutual TLS certificates for encrypted communications
New Product Release Announcement: Aviz ONES 2.0 – A Milestone for SONiC Deployments
ONES (Open Networking Enterprise Suite) stands as a robust network management and supportability solution explicitly designed to tackle the distinctive challenges associated with transitioning to SONiC, an open-source Networking Operating System. Our comprehensive suite serves as a multifaceted Network Orchestration, Visibility, and Assurance platform catering to the complexities of operating multi-vendor and multi-NOS Network Infrastructure. […]