





ONES 4.1 Release Explained: Smart Telemetry Control, Built-In Monitoring, and Modern Network Observability
 February 10, 2026
 ONES & SONiC
Summary
ONES Release 4.1 introduces major enhancements focused on improving observability, control, and operational efficiency across modern network environments. The release delivers immediate operational value while laying the foundation for proactive alerting and rich UI visualization. It elevates user experience through intuitive UI design, richer visualizations, and streamlined workflows that make complex network insights easier to consume and act upon.
Introduction
ONES Release 4.1 introduces enhancements designed to improve observability, control, and operational efficiency across modern network environments. The release focuses on delivering operational value while establishing a strong foundation for proactive alerting and advanced visualization. Key highlights include dynamic telemetry management through Telemetry Preferences and automated host and container health visibility through ONES Monitoring.
Telemetry Preferences Dynamic Telemetry Management
Earlier versions of ONES followed a comprehensive always-on telemetry collection approach. The collector automatically subscribed to all available telemetry paths from each device to ensure complete visibility across the network. This approach highlighted opportunities to improve efficiency and introduce more flexible telemetry control.
ONES 4.1 introduces Telemetry Preferences, a dynamic telemetry management system that allows operators to precisely control telemetry collection. Telemetry preferences are supported across SONiC, Cumulus, Cisco NX OS, Arista, and Compute platforms, enabling teams to tailor telemetry collection based on operational needs.
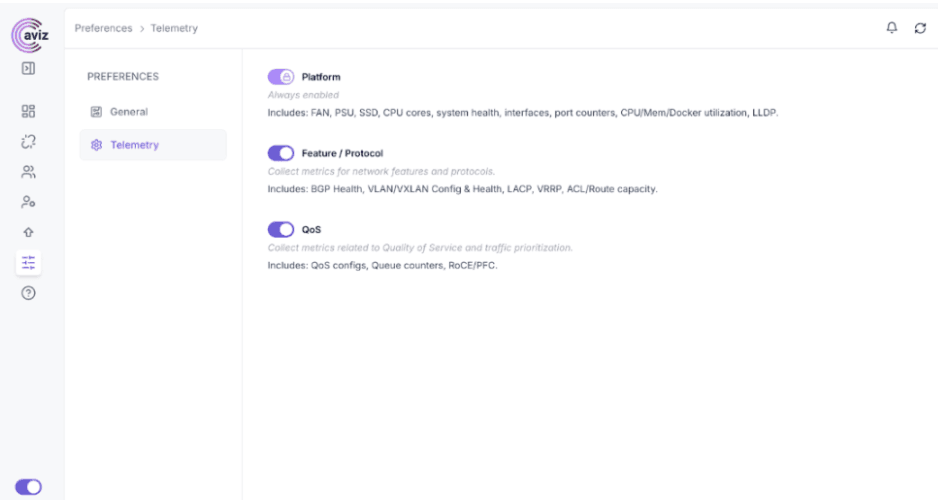
Figure 1 : Telemetry Preferences Window
Telemetry Preference Categories
1. Platform Default
- Platform and hardware information
- Interfaces
- Power supply units
- Fan and environmental metrics
This category is enabled by default to ensure reliable device operation and effective health monitoring.
2. Feature Protocol
- ACL
- Route Capacity
- BGP
- VXLAN
- VLAN
- LACP
Telemetry can be enabled only for actively used features to reduce noise and improve efficiency.
3. QoS Telemetry
- Traffic prioritization
- Queue behavior
- Performance under load
Operators can enable or disable QoS telemetry based on network role and troubleshooting requirements.
Key Benefits of Telemetry Preferences
- Reduced telemetry noise and data volume
- Improved device and collector performance
- Granular feature-level telemetry control
- Consistent telemetry behavior across platforms
ONES Monitoring Built-in System Health Visibility
The Traditional Challenge
In traditional ONES deployments, infrastructure health monitoring required manual server health checks, direct inspection of Docker containers, and reactive troubleshooting after failures occurred. This approach increased operational overhead and delayed issue detection.
ONES Monitoring in v4.1
ONES v4.1 introduces ONES Monitoring, which automatically tracks host-level resource health, including CPU, memory, and disk along with Docker container status and resource utilization. Monitoring metrics are published into the existing telemetry pipeline for seamless integration with observability workflows.
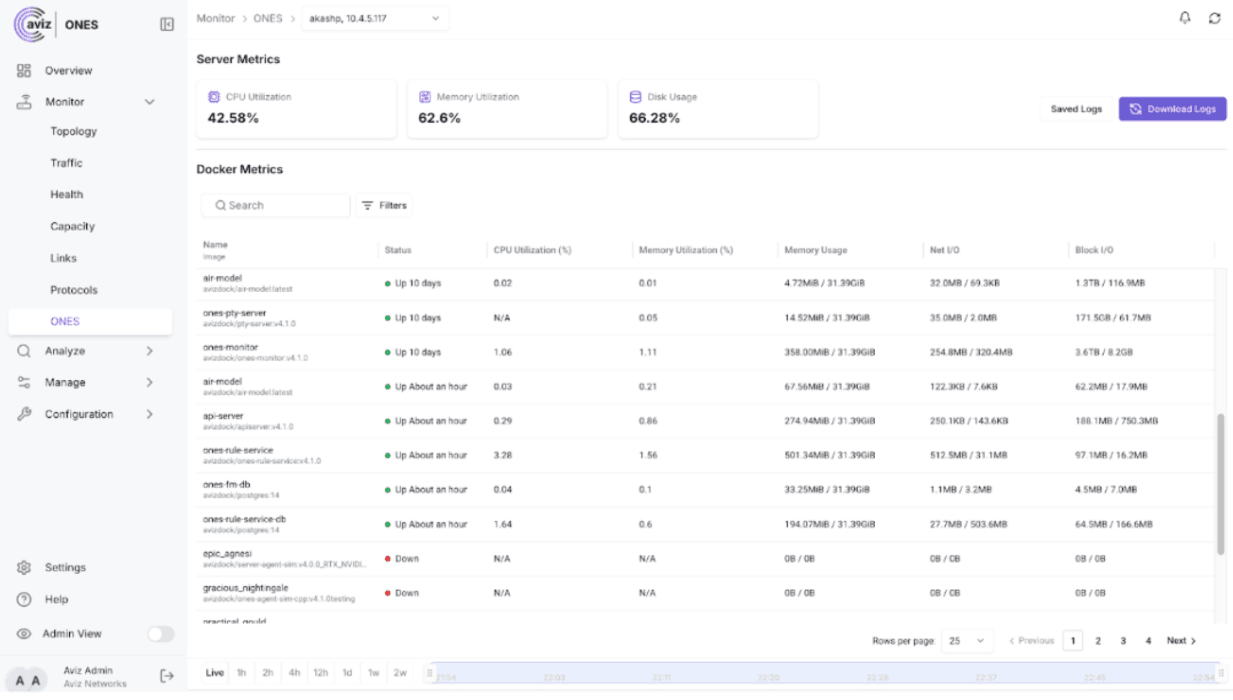
Figure 2: ONES Monitor
Ready for Alerts and UI
ONES v4.1 lays the foundation for proactive alerting and visualization through rule engine integration.
- Definition of CPU, memory, and disk utilization thresholds
- Automated alert triggering when thresholds are breached
- Early detection of issues before outages occur
This reduces mean time to detection and helps prevent service disruptions.
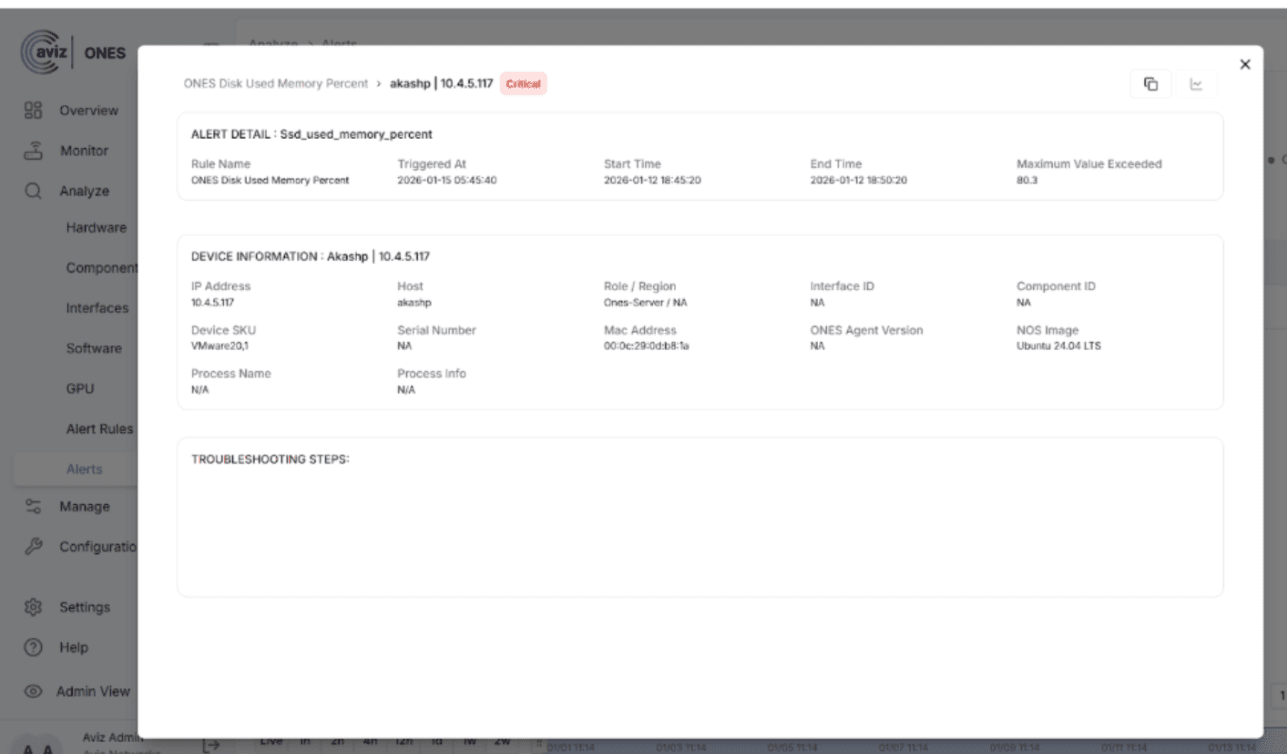
Figure 3 : Rule Alert Payload
Conclusion
ONES v4.1 enhances observability through smart telemetry control with Telemetry Preferences and automated monitoring with ONES Monitoring. The release establishes a strong foundation for proactive alerting and visualization. It improves scalability, efficiency, and operational resilience to help teams stay ahead of issues.
Frequently Asked Questions
What are the two biggest things that changed in ONES 4.1?
Two things stand out. Telemetry Preferences lets operators control exactly which telemetry gets collected instead of pulling everything all the time. ONES Monitoring automatically tracks host-level health including CPU, memory, disk, and Docker container status without anyone setting it up manually. Both changes reduce overhead and give teams better visibility with less noise.
What was wrong with the always-on telemetry approach in earlier ONES versions?
Earlier versions subscribed to every available telemetry path from every device automatically. That sounds thorough but it created unnecessary data volume, added load on devices and collectors, and buried useful signals in noise. ONES 4.1 flips that by letting teams turn on only what they actually need for each device and use case.
What are the three telemetry preference categories in ONES 4.1?
Platform Default covers hardware and environmental basics like interfaces, fans, and power supplies and stays on by default. Feature Protocol covers ACL, BGP, VXLAN, VLAN, LACP, and route capacity and gets enabled only for features that are actually in use. QoS Telemetry covers traffic prioritisation, queue behaviour, and performance under load and can be switched on or off based on the device role and what the team is troubleshooting.
Which platforms does Telemetry Preferences support?
Telemetry Preferences works across SONiC, Cumulus, Cisco NX-OS, Arista, and Compute platforms. Teams running mixed-vendor environments get consistent telemetry control across the whole fleet rather than having to manage collection differently for each platform.
How did infrastructure health monitoring work before ONES Monitoring and what changed?
Before 4.1, checking server health meant doing it manually, inspecting Docker containers directly, and finding out about problems only after something broke. ONES Monitoring in 4.1 handles all of that automatically. CPU, memory, disk, and container metrics publish into the existing telemetry pipeline so the data is already there before anyone files a ticket.
What does ONES 4.1 set up for proactive alerting going forward?
The rule engine integration in 4.1 lets teams define CPU, memory, and disk utilisation thresholds. When a threshold gets breached, an alert fires automatically. The idea is catching issues early enough to act before they turn into outages rather than discovering problems after users start complaining or services go down.
Why does collecting less telemetry actually improve network observability?
Pulling every metric from every device all the time adds load to both the devices and the collector and buries the signals teams actually care about. When operators turn on only the telemetry relevant to each device's role and active features, the data that comes back is cleaner and easier to act on. Less volume with better targeting beats more volume with no filter every time.
How does publishing monitoring metrics into the existing telemetry pipeline help operations teams?
Host and container health data lands in the same place as network telemetry rather than sitting in a separate system. Teams checking on network performance and teams checking on infrastructure health look at the same pipeline. No switching between tools, no correlating data from two different sources manually, and no gap between when a problem starts and when someone sees it.
Explore how ONES 4.1 enhances observability and operational control with smarter telemetry management and built in system monitoring.


