




Make every AI request measurable.
GPUs can be healthy while AI applications perform poorly.
You're billed for tokens and blamed for latency, but the traffic between the user and the model is still a black box. Traditional observability tells you traffic is flowing — AI-Parser tells you what that traffic means.
Know who is consuming AI
Separate traffic by user IP, tenant, application, or stable API-key identity, not only by model.
Measure real token usage
Capture input, output, and total token counts carried in the AI response, then roll them up by tenant.
See the experience users receive
Track time to first token, end-to-end response time, inter-token latency, and tokens per second.
Find waste and contention
Identify aborted streams, truncated answers, over-allocation, noisy neighbors, and struggling workloads.
AI-Parser observes the request and response as delivered on the wire, creating an independent transaction record for AI usage and experience.
See the AI call, not just the GPU.
AI-Parser reconstructs OpenAI-compatible HTTP and JSON traffic, including streamed responses, to expose the information needed for cost, performance, governance, and operations.
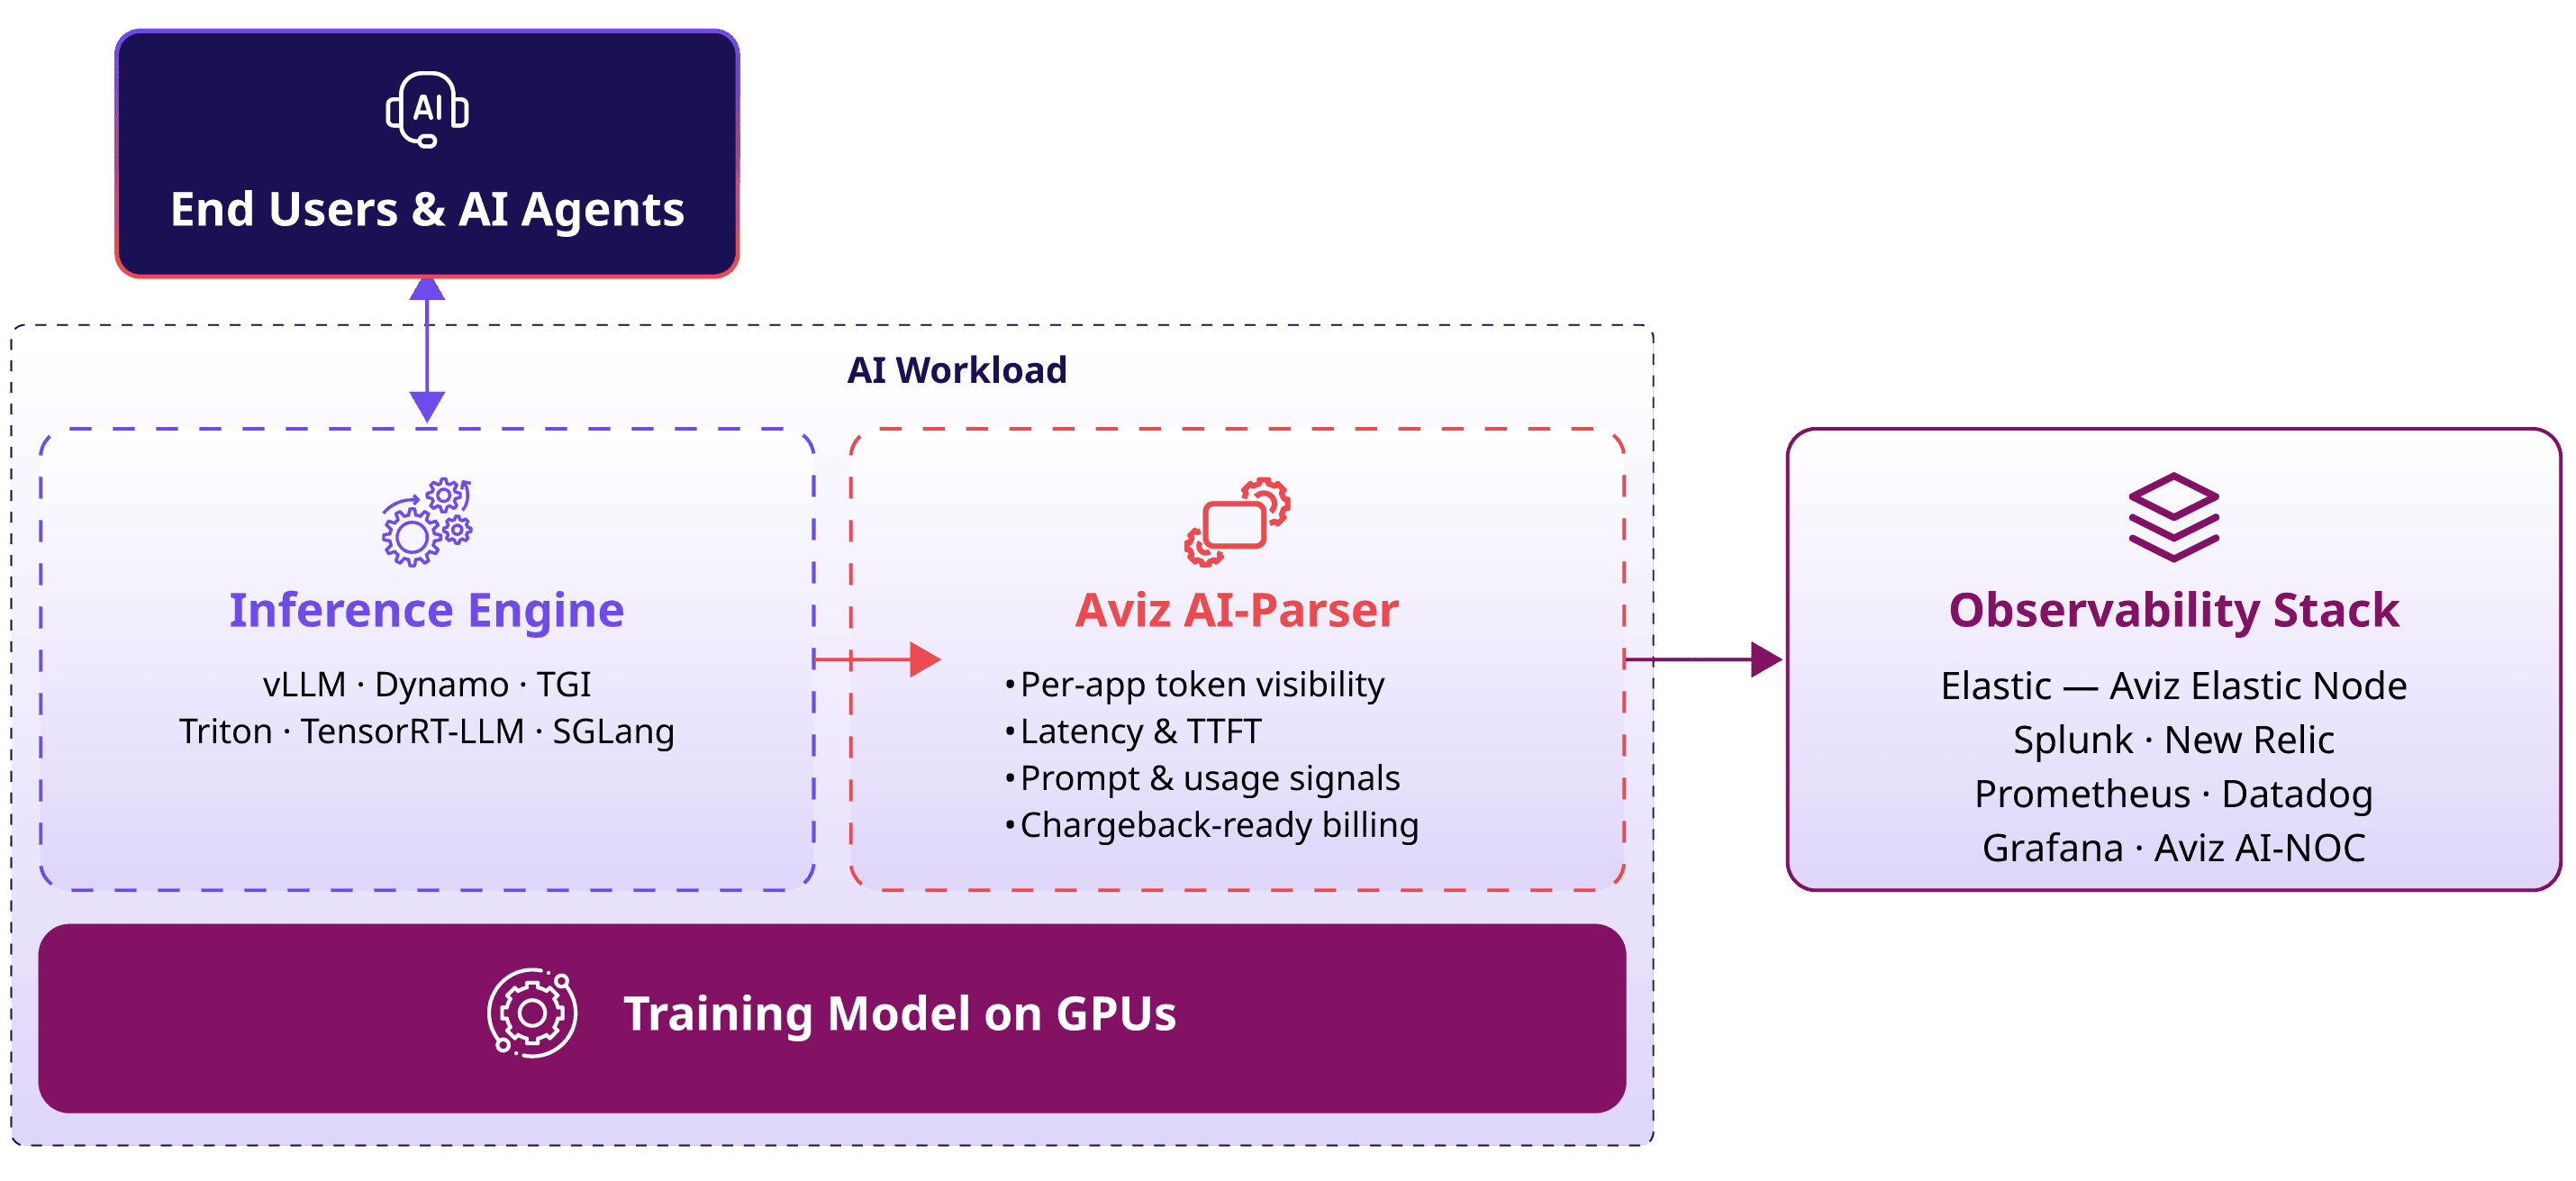
AI-Parser runs as a lightweight service alongside the inference engine, on the same node — no mirrored tap, no separate DPU or x86 appliance required.
Turn shared GPU infrastructure into accountable services.
When the orchestration platform maps each tenant or application to an IP and GPU allocation, AI-Parser records align naturally with that model.
From raw AI transactions to live operational views
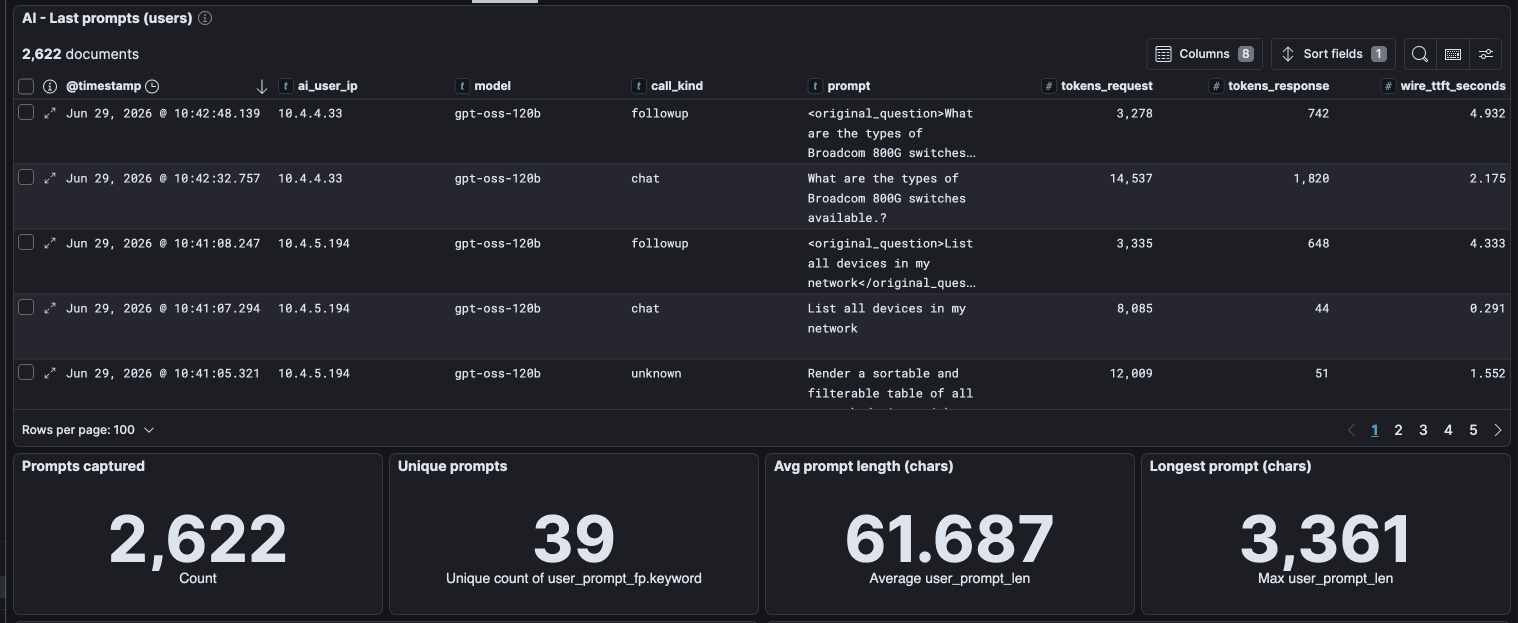
Per-request dashboard
Review user identity, model, prompt, token counts, and delivered latency.
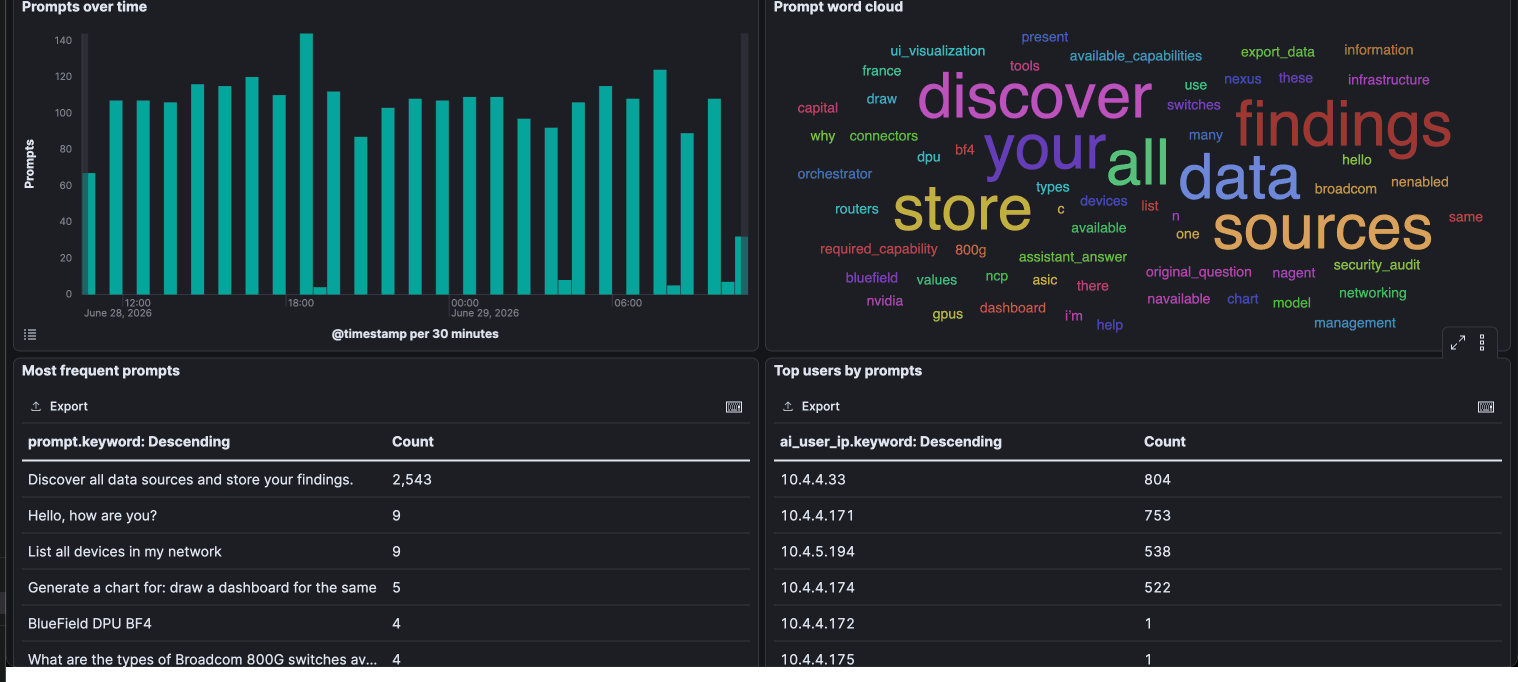
Usage trends
Track prompt activity, frequent requests, and top users over time.
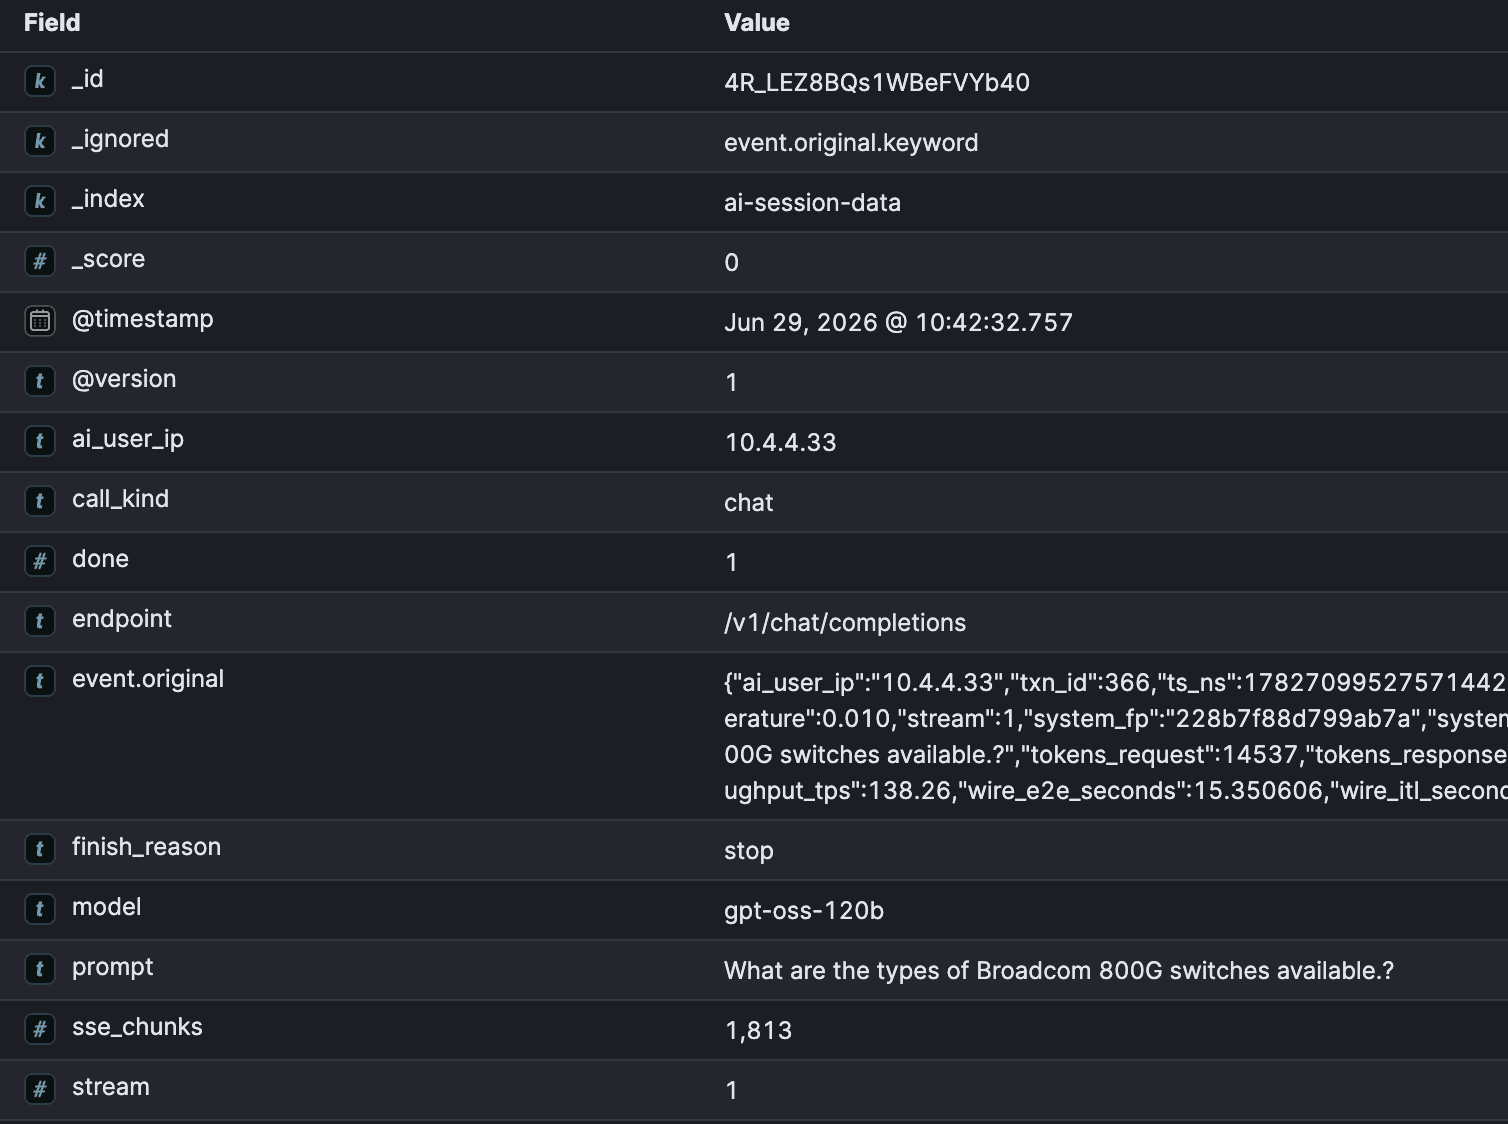
Transaction metadata
Identity, tokens, prompt signals, performance, and completion status.
What AI-Parser adds beyond model-server metrics
Engine metrics stay the best source for GPU internals. AI-Parser adds identity, content, and delivered experience.
| Area | Model-server view | AI-Parser view | Why it matters |
|---|---|---|---|
| Identity | Aggregate, labelled by model | Client IP, tenant, stable API-key identity | Chargeback, SLA, and accountability per tenant |
| Prompt content | Never exposed | Parsed from the body — fingerprint or text | Governance, DLP, prompt-cache analysis |
| Tokens | Self-reported by the engine | Counted independently on the wire | An audit trail against mis-billing and drift |
| End-to-end latency | Request entry to completion | First request byte to last response byte | The latency the user actually experienced |
| Time to first token | Admit to first token | Request in to first byte out | Catches host stack, API server, and queue delay |
| Aborts and waste | Partial failure counters | TCP FIN/RST with no completion marker | Sees the client hang up, and attributes it |
Vendor-neutral: vLLM, TGI, Triton, TensorRT-LLM, Dynamo, and SGLang all speak the same OpenAI-compatible schema, so AI-Parser reads them the same way.
A different use case for every team, from one read.
The same passive read of AI traffic answers a different question depending on who's asking.
Performance as delivered
Time to first token, wire end-to-end time, inter-token latency, throughput, and stream completion.
Identity and privacy controls
Per-IP and per-tenant records, stable identity fingerprints, prompt hashing by default, and optional raw text.
Agentic-flow visibility
Observe the multiple backend model calls created by one user question and regroup related calls through identity.
Honest, structured records
Read or compute fields from observed traffic. When a value is not present, leave it blank instead of guessing.
End-to-end visibility
Understand AI traffic from the application and agent through the network to the LLM and GPU.
AI consumption
Measure prompt, completion, and total token usage by application, workload, or model.
GPU efficiency
Spot expensive GPUs waiting on traffic, requests, or application dependencies.
Open telemetry
Export enriched inference KPIs via Kafka into your existing stack.
Talk to us about licensing.
Pricing details coming soon
AI-Parser licensing terms are being finalized. Talk to an Aviz architect for current pricing and deployment options for your environment.
Technical questions.
Does AI-Parser require instrumenting my application?
No. It observes traffic as delivered on the wire — there's nothing to instrument in the application or inference engine.
Where does it deploy?
As a lightweight service on the GPU node, alongside the inference engine — no mirrored tap, no separate DPU or x86 appliance, and nothing inline in the request path.
Which inference engines does it support?
vLLM, TGI, Triton, TensorRT-LLM, Dynamo, and SGLang — all read the same way, since they share an OpenAI-compatible schema.
Does it store my users' prompts?
Prompts are converted to one-way fingerprints by default. Raw prompt text is retained only when explicitly enabled.
What happens to fields AI-Parser can't observe?
They're left blank — never guessed or fabricated.
How does this relate to my model server's own metrics?
They're complementary, not competing. Model-server metrics remain the best source for GPU internals; AI-Parser adds the identity, content, and delivered-experience context that's only visible on the wire.