





How Does Network Copilot AIOps Enhance Zabbix Monitoring for Agentic NetOps?
 November 12, 2026
 Network Copilot ™
TL;DR
NetOps for Zabbix connects Network Copilot to an existing Zabbix server in read-only mode, so engineers can ask about monitored hosts in natural language without leaving Copilot. Network Copilot retrieves Zabbix problems, triggers, metrics and interface data and returns the answer as tables and charts in the same conversation. Zabbix is added as a data connector with a name, Zabbix URL and API token, and the agent cannot change a host, a trigger or a problem. Teams move from "what is alerting?" to "what is happening, where, and what should I look at next?" in one chat.
Introduction
Network Copilot is where network teams already come to investigate issues, correlate signals, and understand what is happening across their infrastructure. Instead of jumping between monitoring tools, dashboards, and device-specific views, teams can ask a question in Copilot and bring the relevant operational context into one troubleshooting workflow. Zabbix is already an important part of that environment for many teams. It monitors problems, triggers, CPU and memory usage, temperature, fans, power supplies, interfaces, and other host-level health signals. But when Zabbix stays separate, an alert can still send an engineer out of Copilot and into another UI to find the affected host, inspect graphs, check trigger history, and piece together what changed.
NetOps for Zabbix closes that gap inside Network Copilot. The Zabbix agent connects Copilot to an organization’s existing Zabbix server in read-only mode, so engineers can ask about monitored hosts directly in natural language. Network Copilot retrieves the relevant problems, triggers, metrics, and interface data, then brings the answer back into the same conversation as tables and charts.
The result is that Zabbix becomes part of the Copilot investigation instead of a separate destination. Teams can move from “what is alerting?” to “what is happening, where, and what should I look at next?” without breaking the troubleshooting flow.
How do you connect Zabbix to Network Copilot?
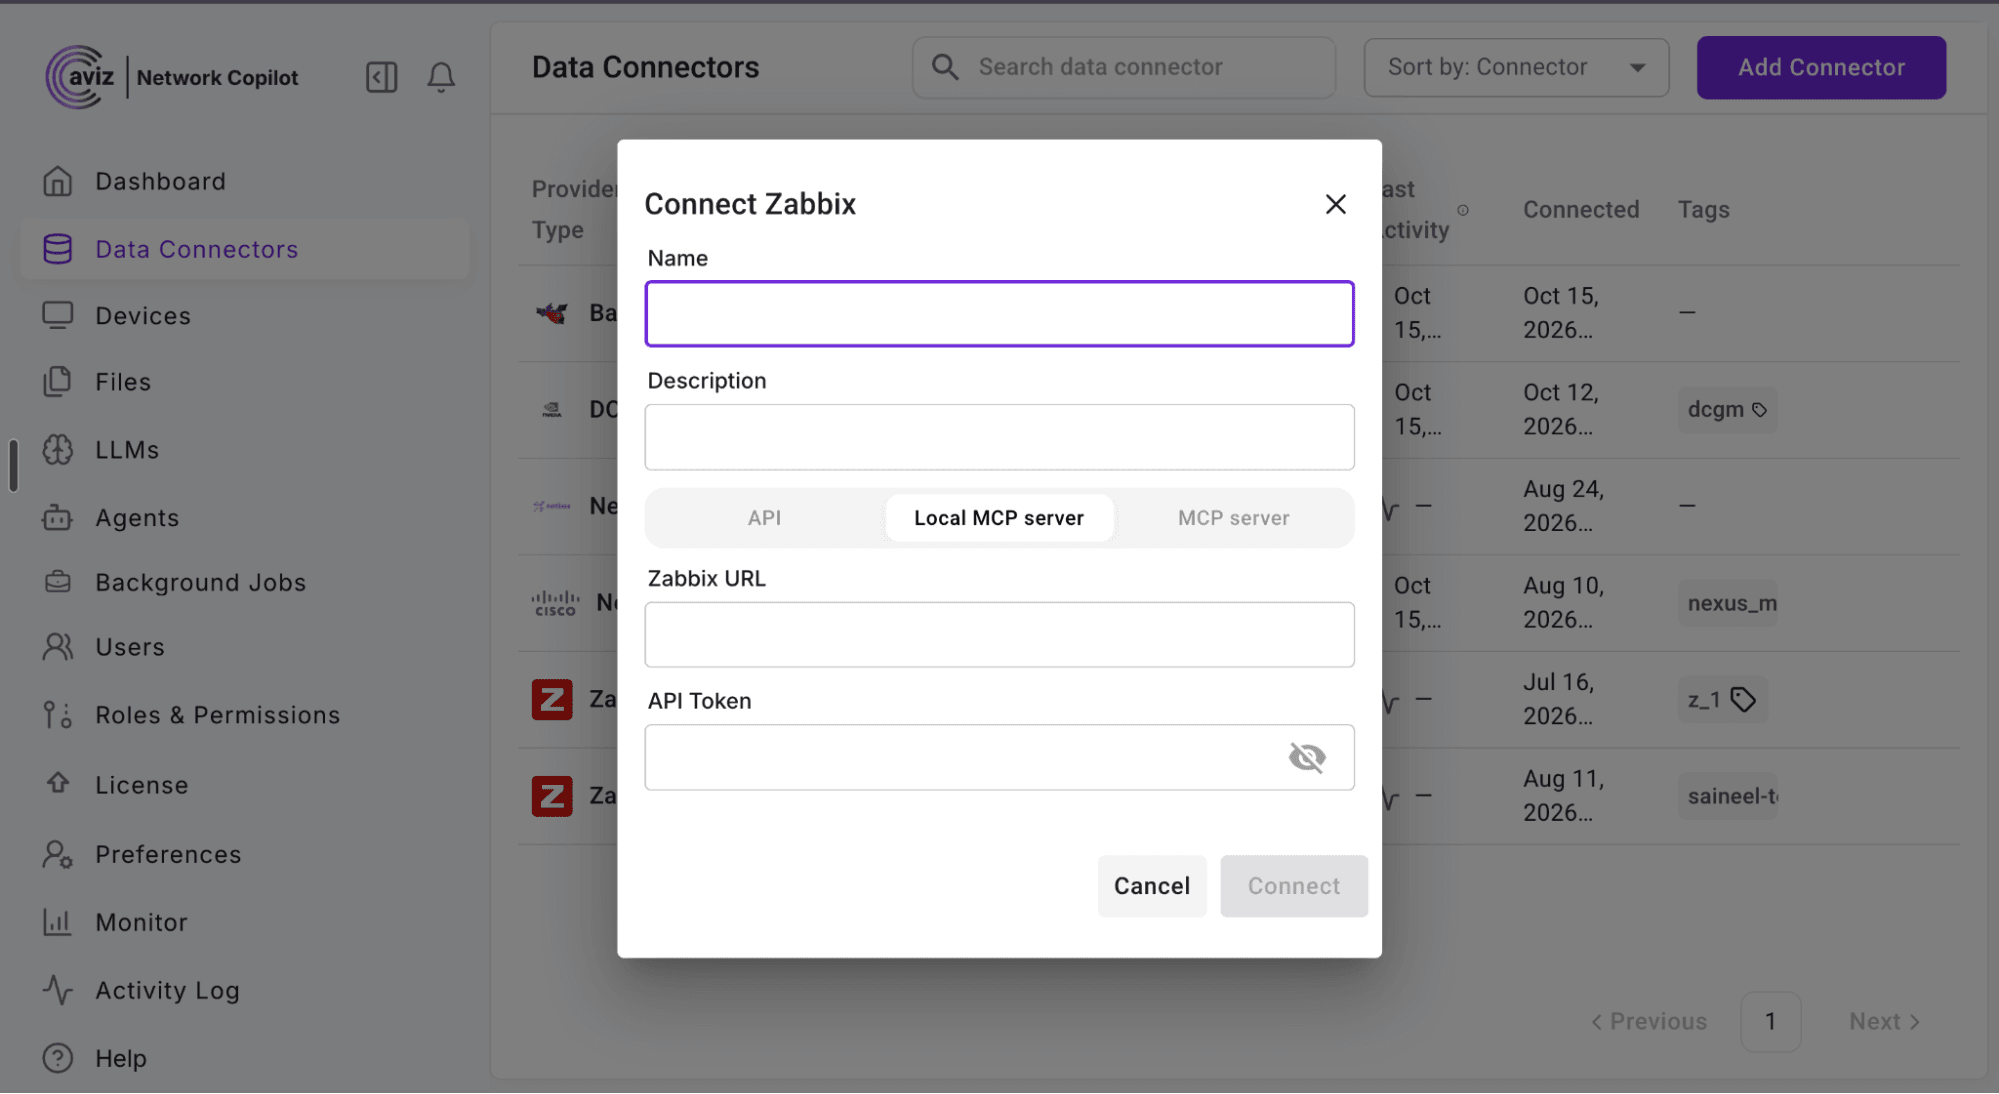
In NCP, Zabbix is a data connector, same as Catalyst Center, Nexus Dashboard or NetBox. You add it under Data Connectors with a name, your Zabbix URL and an API token, then enable it on the project.
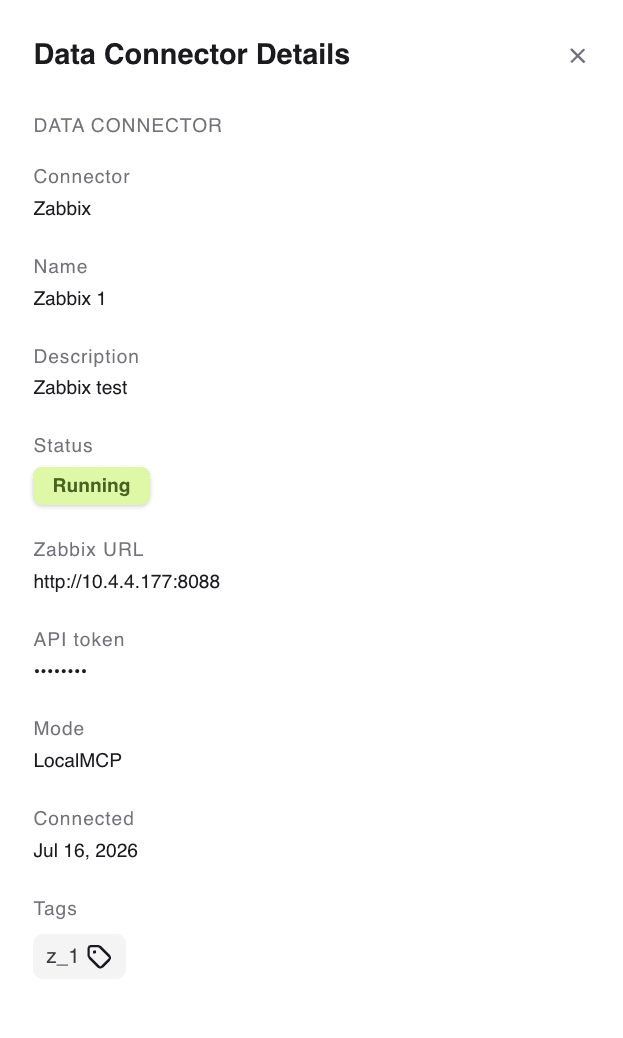
Once connected, the connector shows as Running. Its details list the Zabbix URL, the mode and the date it was connected; the API token stays masked.
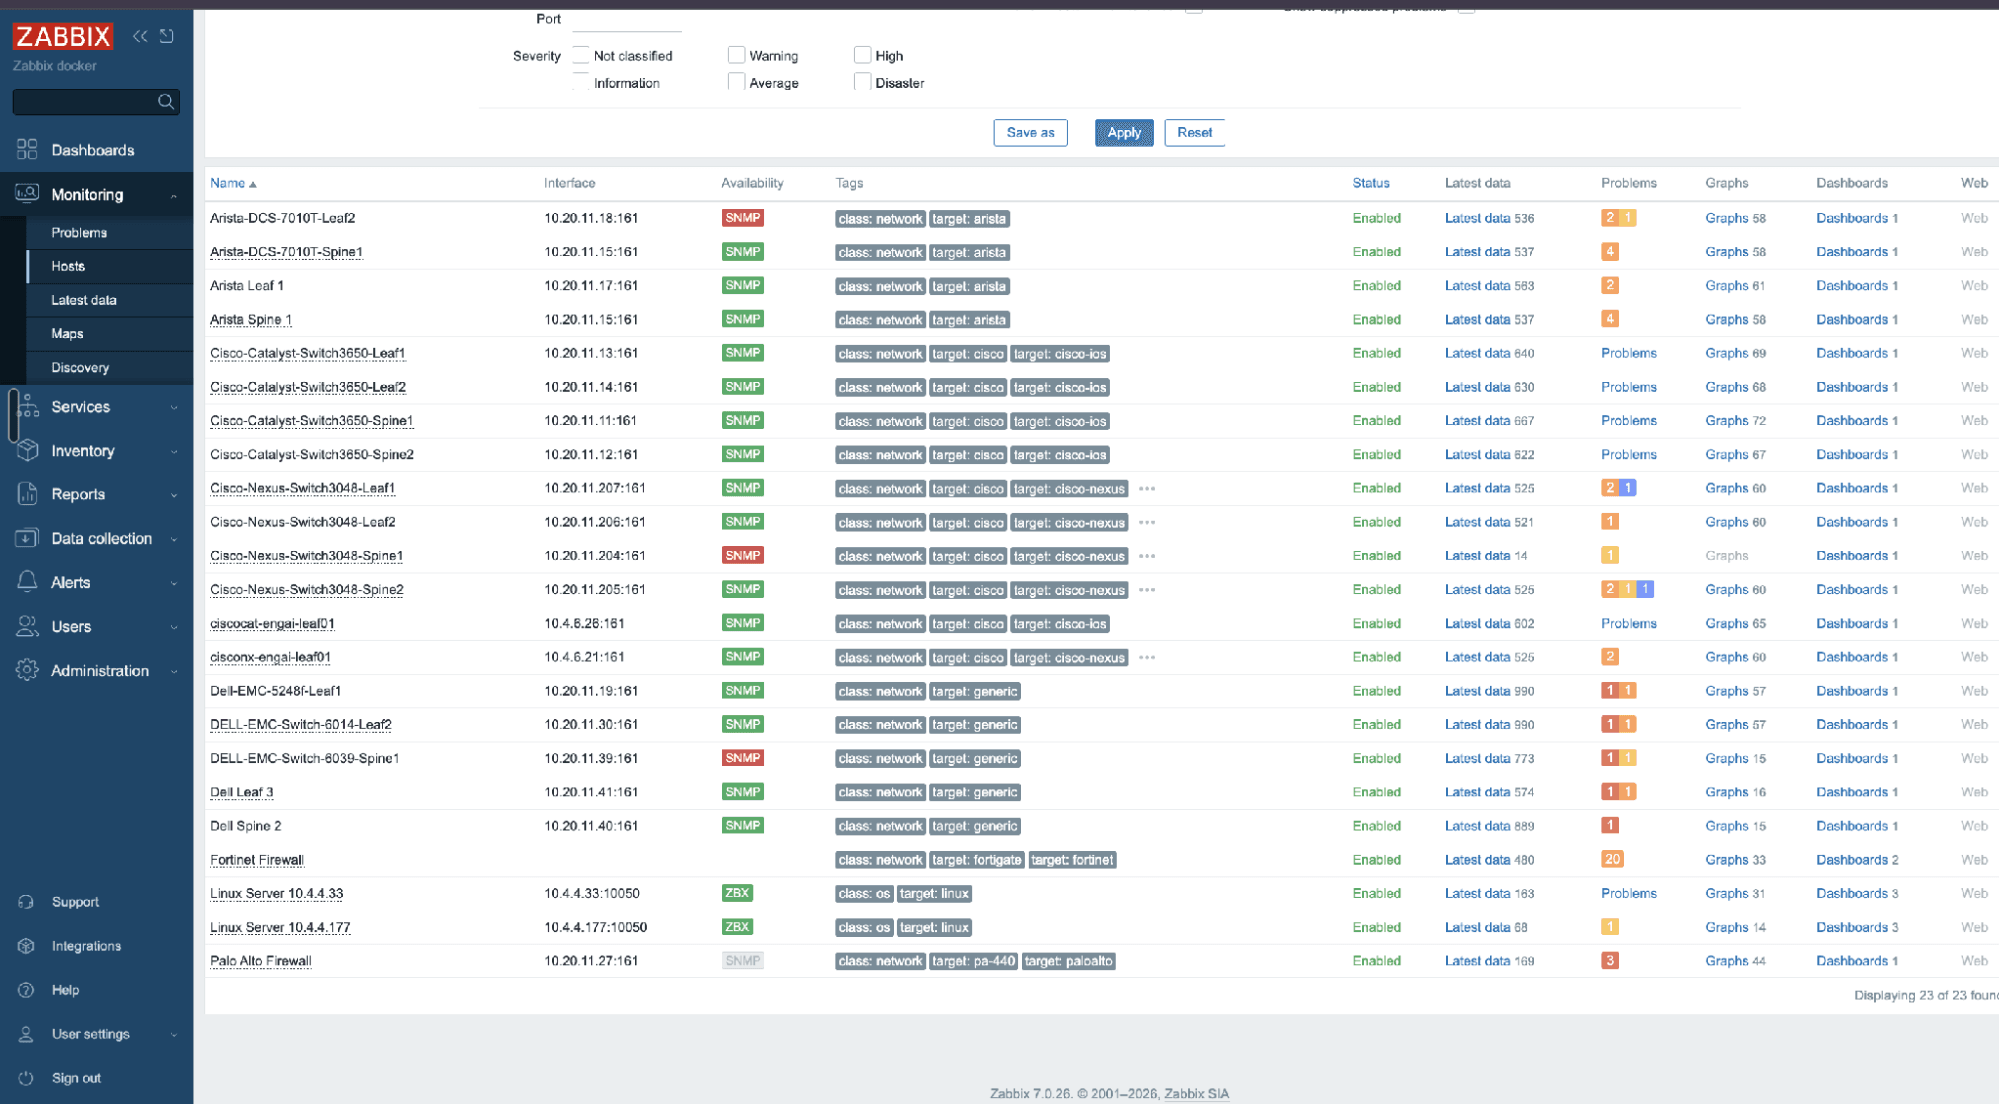
Behind the connector sits a Zabbix agent that knows how to ask Zabbix the right question. It is read-only by design: it can look at anything Zabbix monitors, and it cannot change a host, a trigger or a problem. Charts and tables are drawn straight from Zabbix data, so every number on screen is the one Zabbix holds.
What you can ask about:
- Inventory: model, serial, OS version and management IP
- Live metrics: CPU, memory, temperature, fans, power supplies, disk and uptime
- Problems and triggers: what is firing now or in a window, by severity or host
- Interfaces: admin and oper status, speed, errors, discards and throughput
- Fleet views: rank or compare every host on any metric
- Charts: any metric over any window Zabbix holds history for
Zabbix stays where you manage hosts. Add one there and Copilot can answer about it on the next question. The fleet in this walkthrough is 23 hosts: 4 Arista, 10 Cisco (Nexus and Catalyst), 5 Dell/SONiC, 2 firewalls (Fortinet, Palo Alto) and 2 Linux servers.
How does an engineer troubleshoot a Zabbix alert in Network Copilot?
Suppose Zabbix alerts have piled up across the fleet overnight. The engineer does not start in the Zabbix UI. They open Network Copilot and stay in one chat. The questions are the usual ones: what is firing, when it started, whether a hardware fault is hurting the box, and whether the metrics back up the alert. Each answer is a table or chart from Zabbix for the hosts named in the question.
Which Zabbix problems are firing across the fleet?
Start with the whole fleet, ranked by severity.
Give me a fleet-wide health triage, summary of what problems are firing right now, ranked by severity?
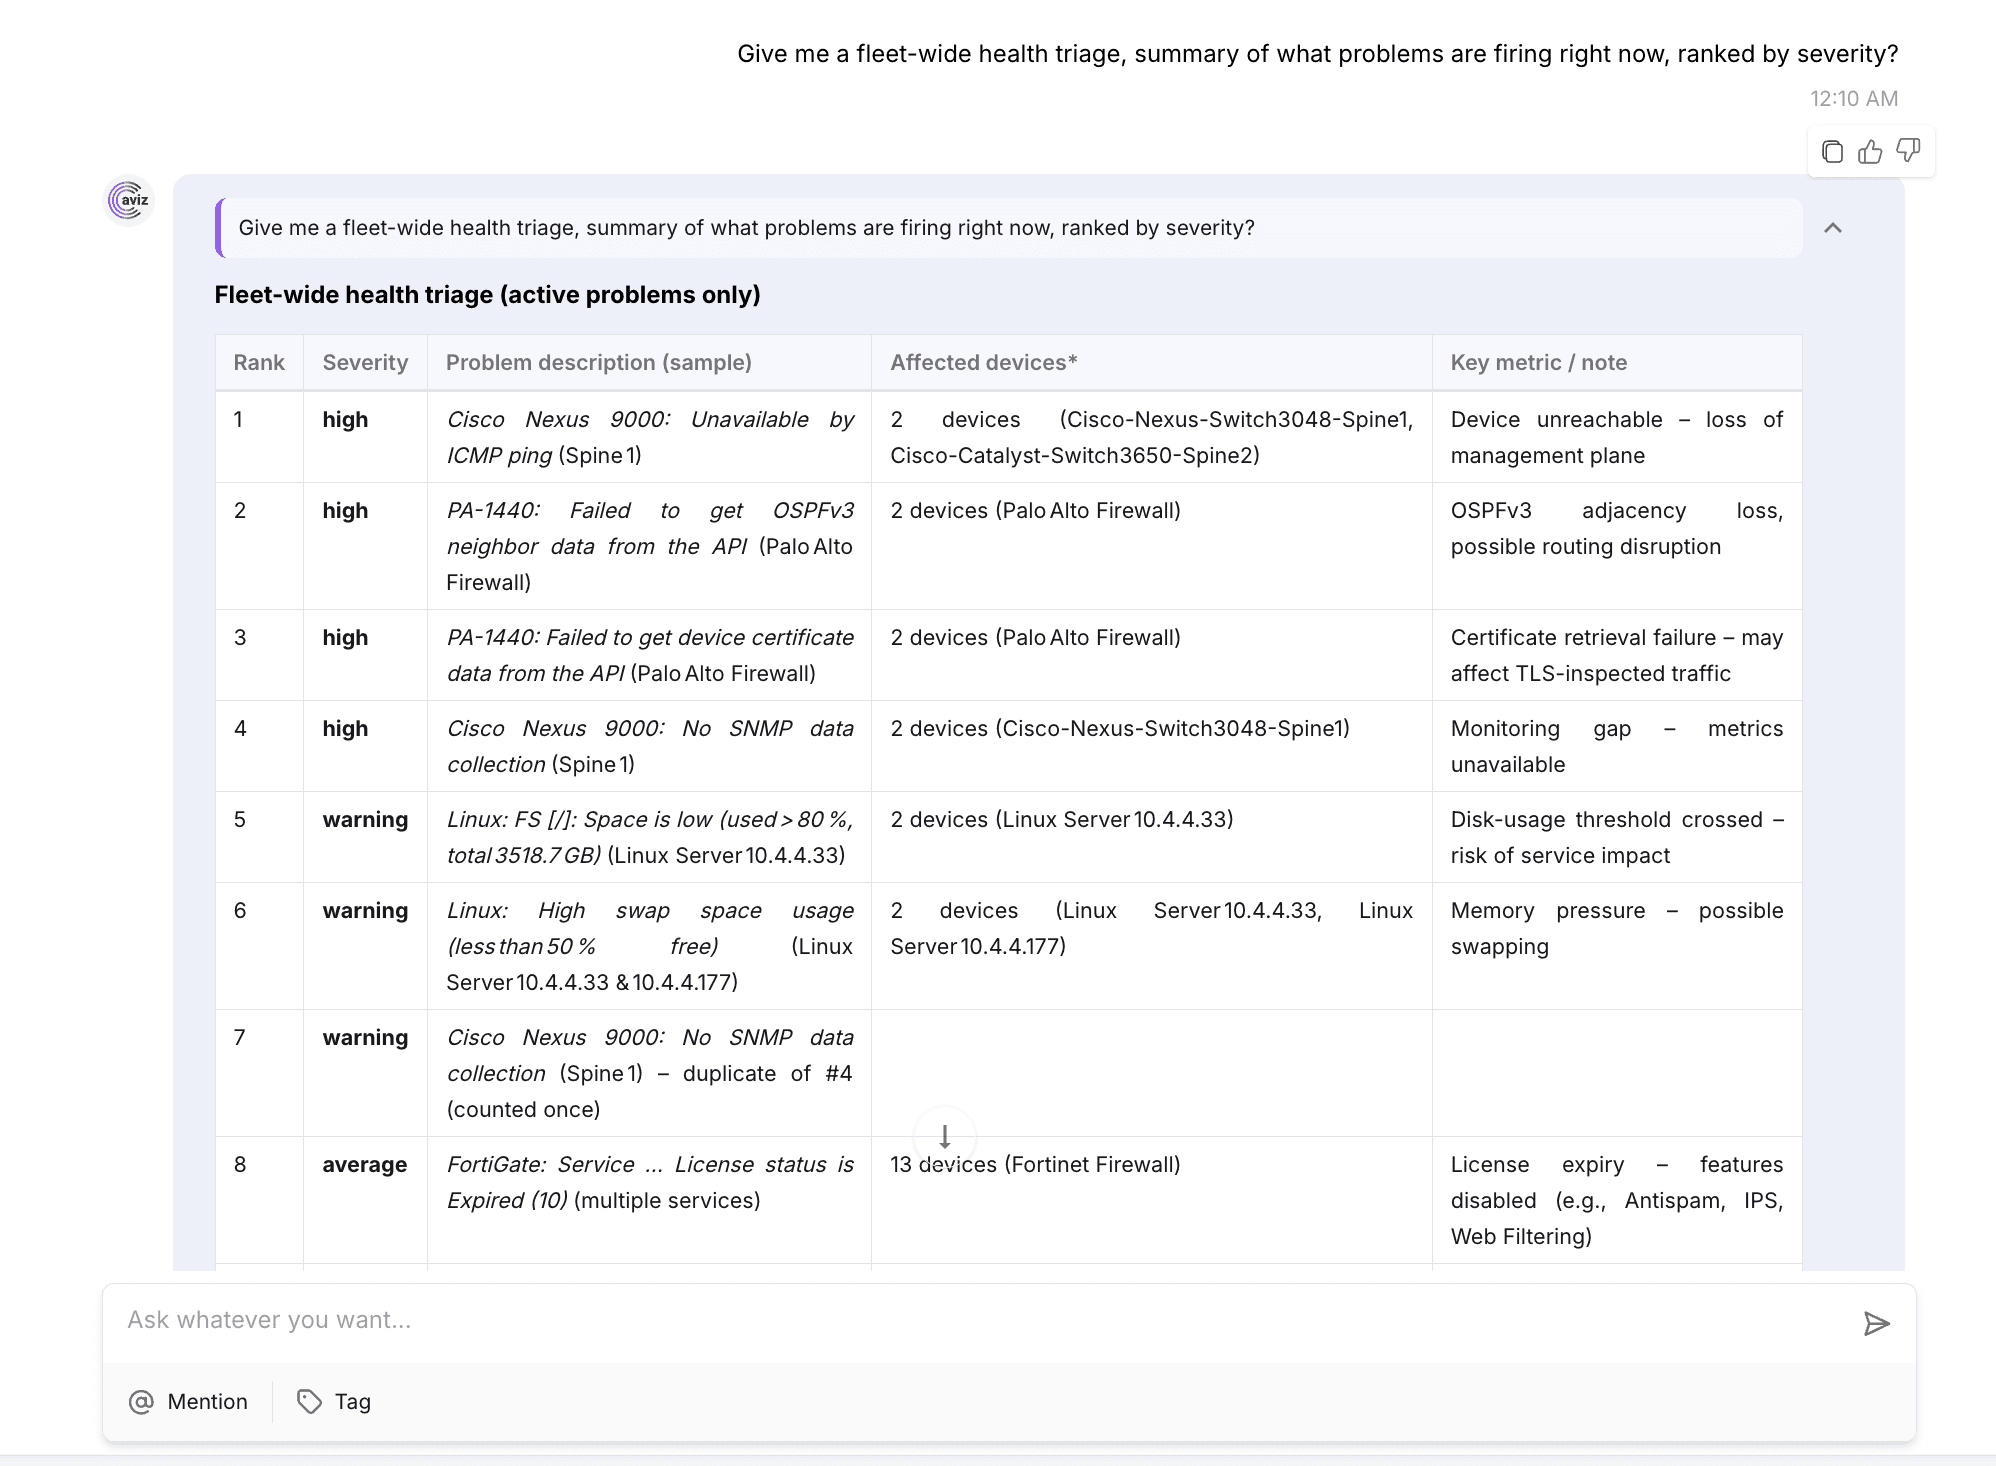
Copilot lists active problems only, highest severity first. The high ones come first: Cisco-Nexus-Switch3048-Spine1 and Cisco-Catalyst-Switch3650-Spine2 are unreachable by ICMP ping, Zabbix cannot pull OSPFv3 neighbor or certificate data from the Palo Alto API, and a Nexus switch has stopped returning SNMP data. Below those, both Linux servers have swap warnings and 10.4.4.33 has its root filesystem over 80%. Expired FortiGate licenses (Antispam, IPS, Web Filtering) close the list. That is the worklist for the rest of the chat.
When did the Zabbix alerts start?
Next, find out whether this was one storm or a slow build.
Timeline of problems summarized across the fleet for the last 24 hours, were there any event clusters overnight?
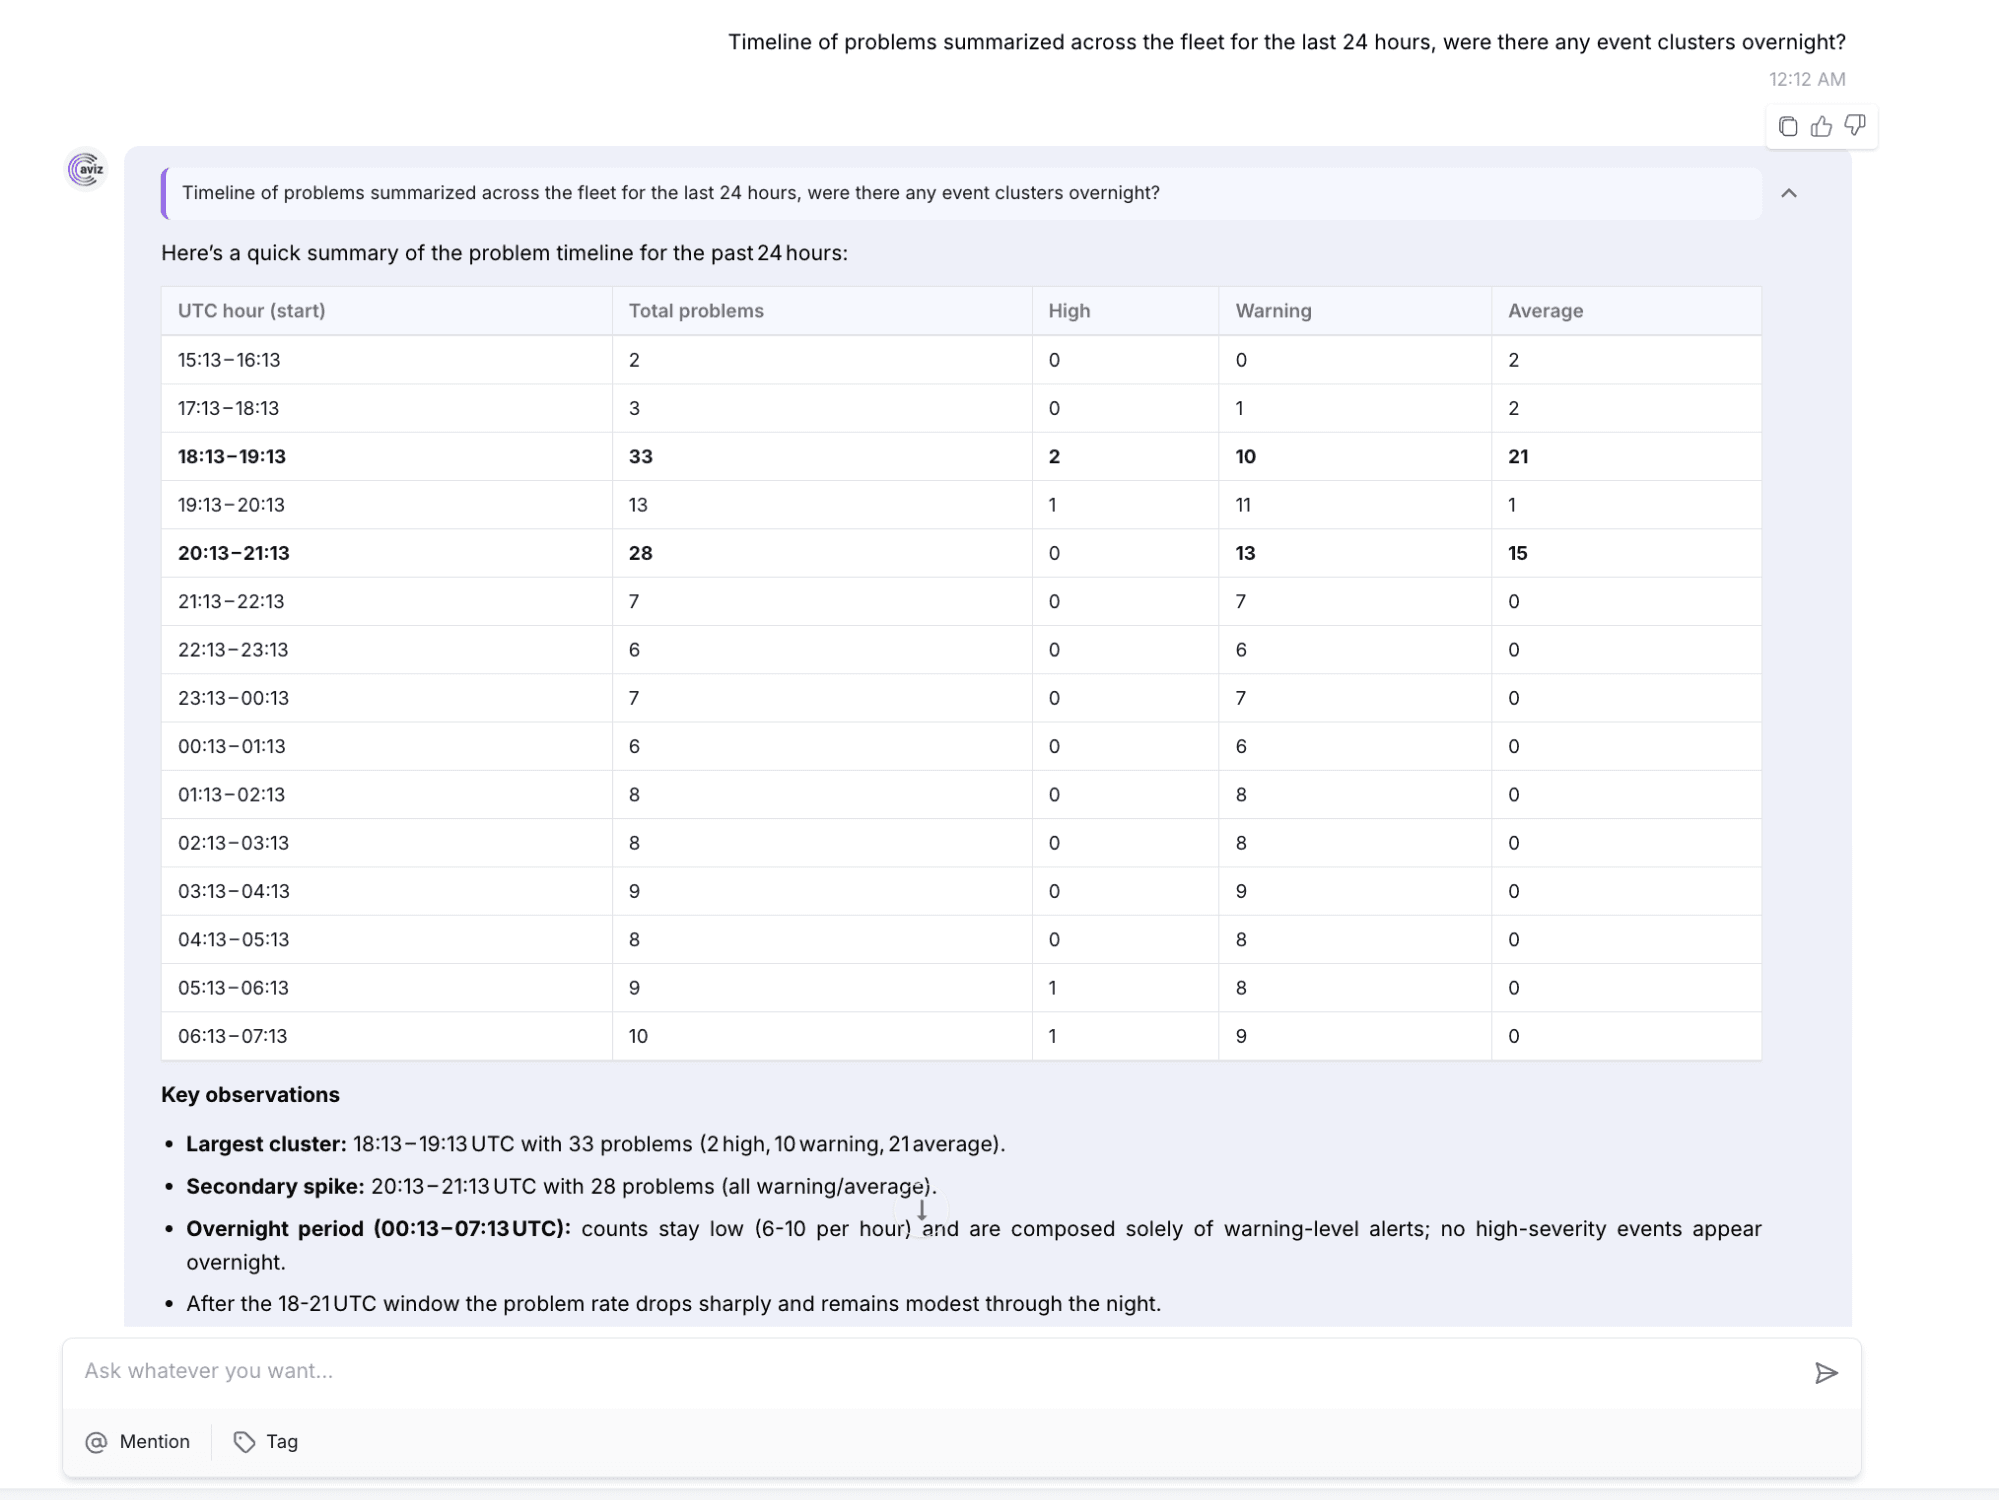
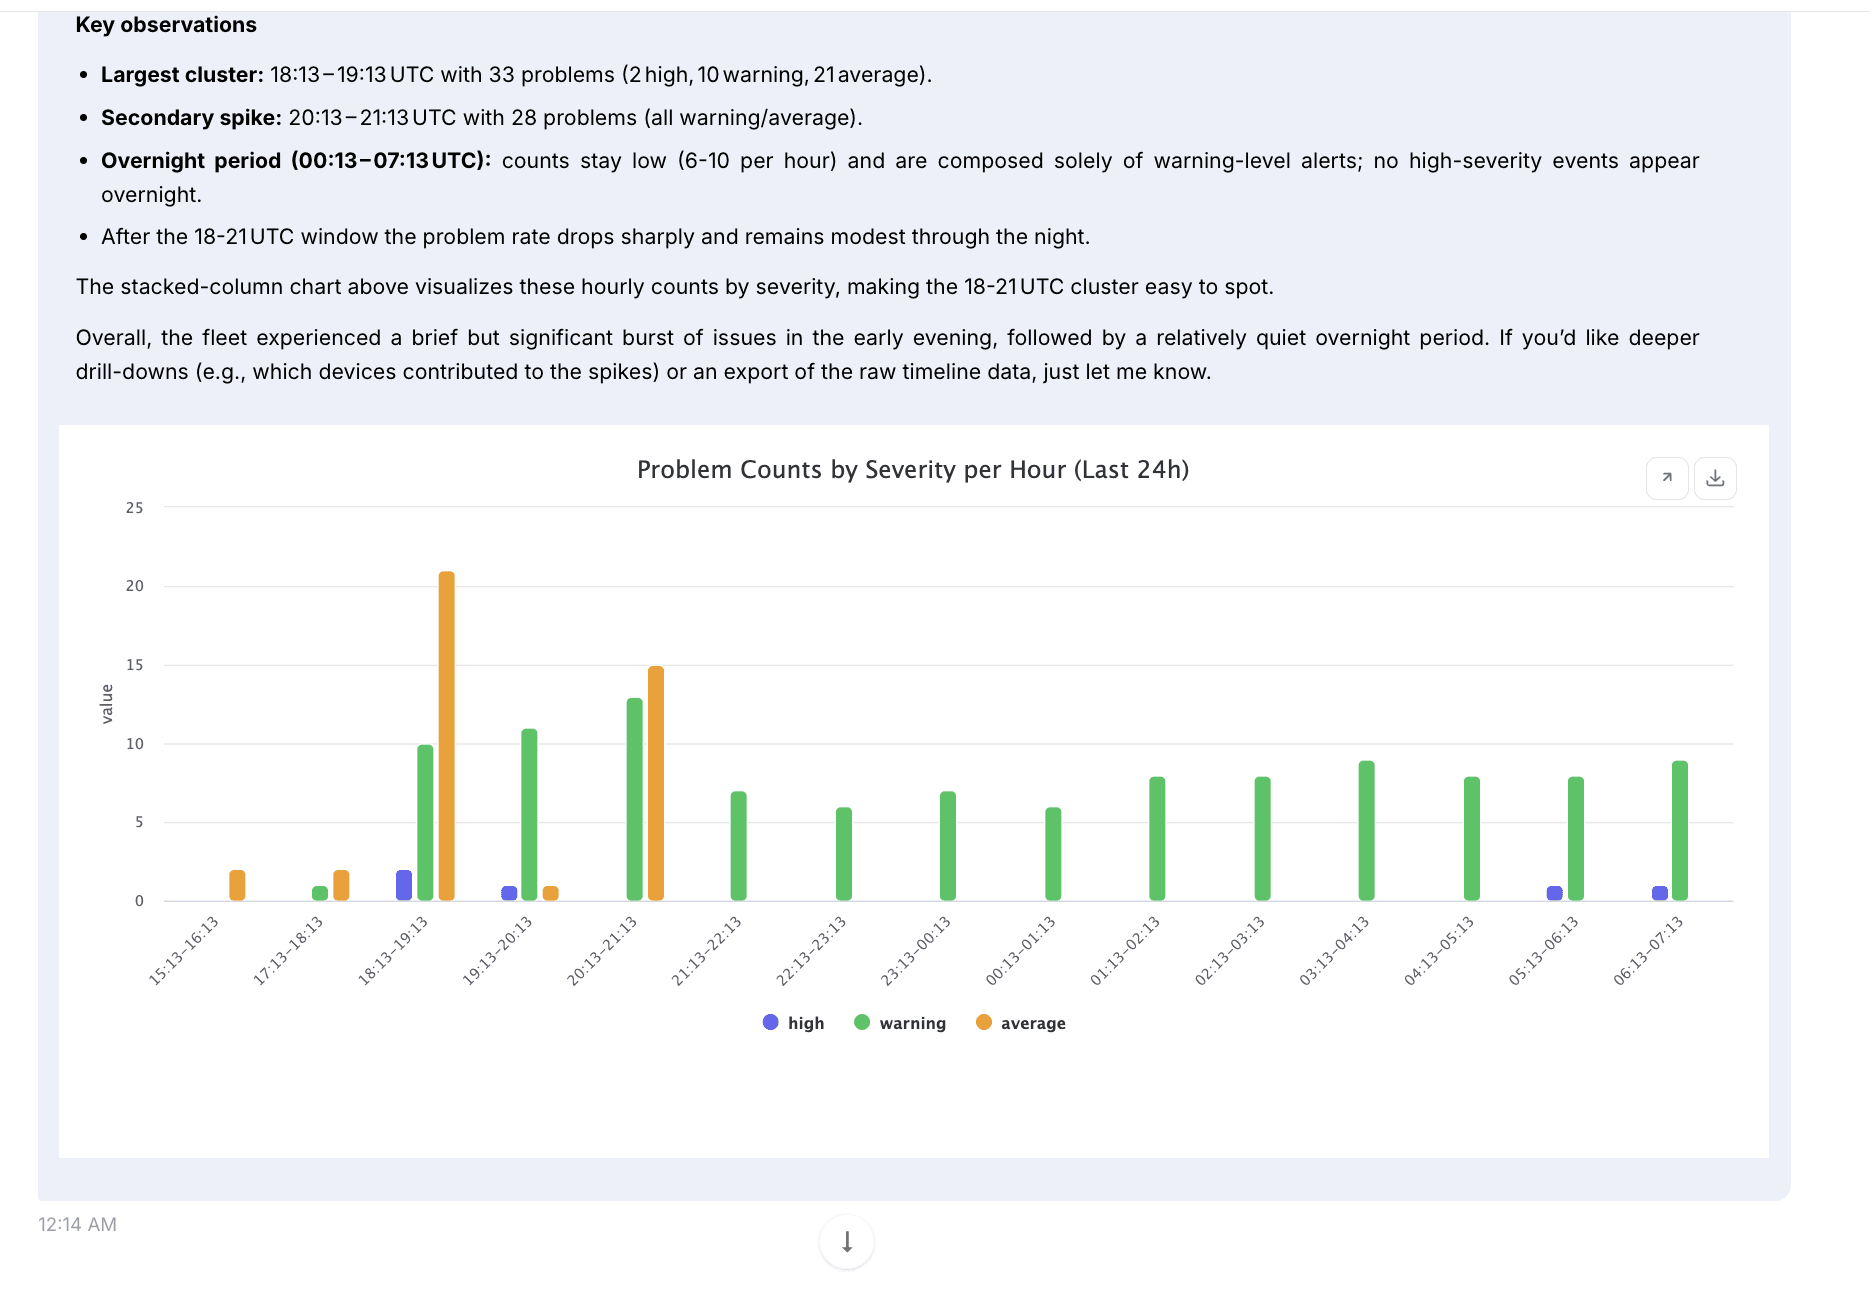
Copilot buckets the last 24 hours by hour and severity, then draws the chart itself. Two clusters stand out: 33 problems at 18:13–19:13 UTC (2 high, 10 warning, 21 average) and 28 at 20:13–21:13 UTC. From 00:13 to 07:13 UTC the rate holds at 6–10 an hour, nearly all warnings, with one high-severity problem in each of the last two hours. The evening burst is the event to chase.
Is a failed fan heating the switch?
Zabbix reports PowerSupply-1 Fan-1 down on Cisco-Nexus-Switch3048-Spine2. The next question is whether that is costing temperature.
Draw a chart for all temperature sensors on Cisco-Nexus-Switch3048-Spine2 for the last week, is the failed fan causing thermal drift?
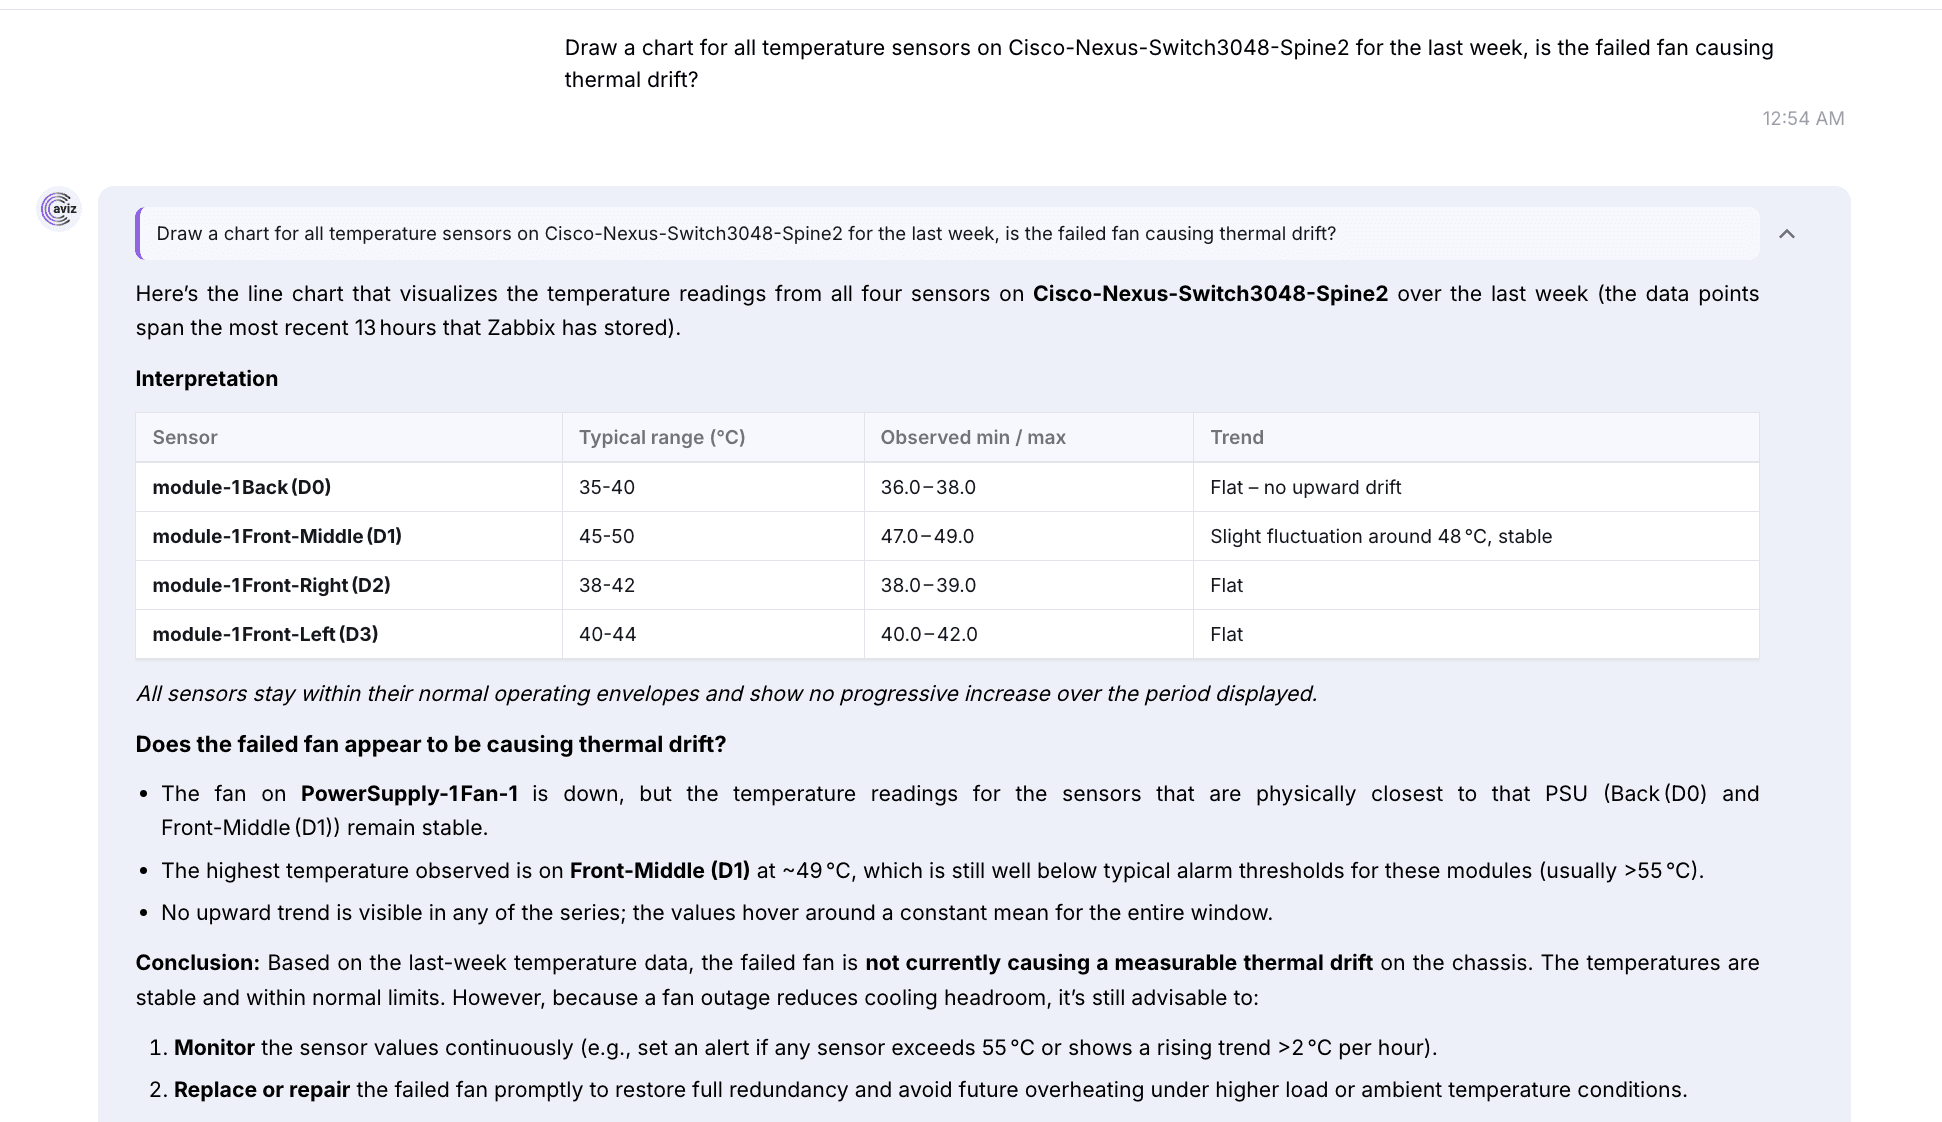
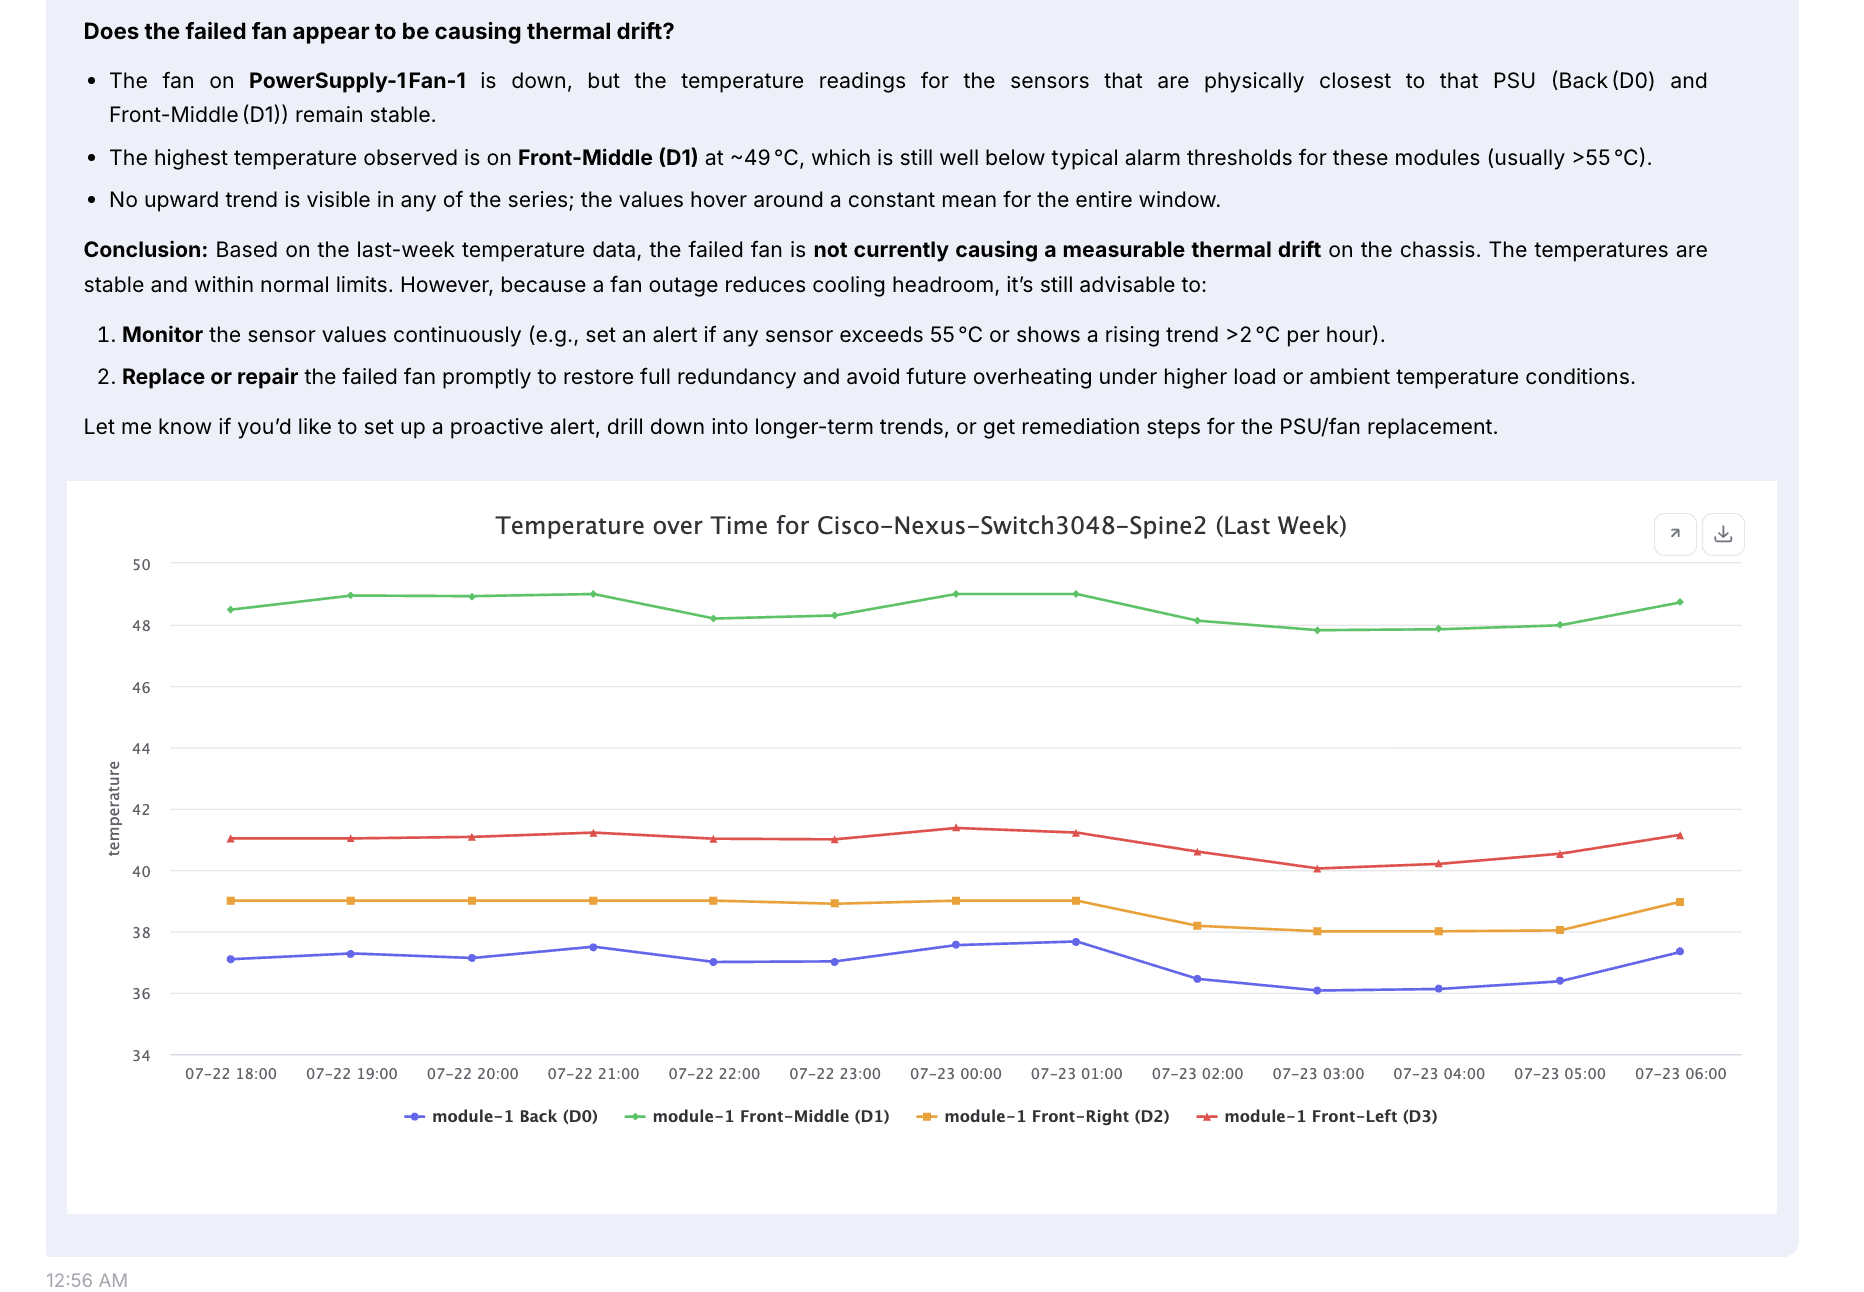
Copilot puts all four module-1 sensors on one chart. The hottest, Front-Middle (D1), holds at 47–49 °C. Back (D0) reads 36–38 °C, Front-Right (D2) 38–39 °C and Front-Left (D3) 40–42 °C. No sensor trends up, so the fan is not causing measurable drift yet, but it still needs replacing to restore cooling headroom. A week was asked for and Zabbix held only the last 13 hours for these sensors; the answer says so up front.
Are the Linux servers really short on memory?
Both Linux servers showed swap warnings in the triage. Ask when each alert started, and look at their memory side by side.
Both Linux servers fired swap alerts, when exactly did each start, draw a chart of their memory utilization over the last 48 hours on one graph
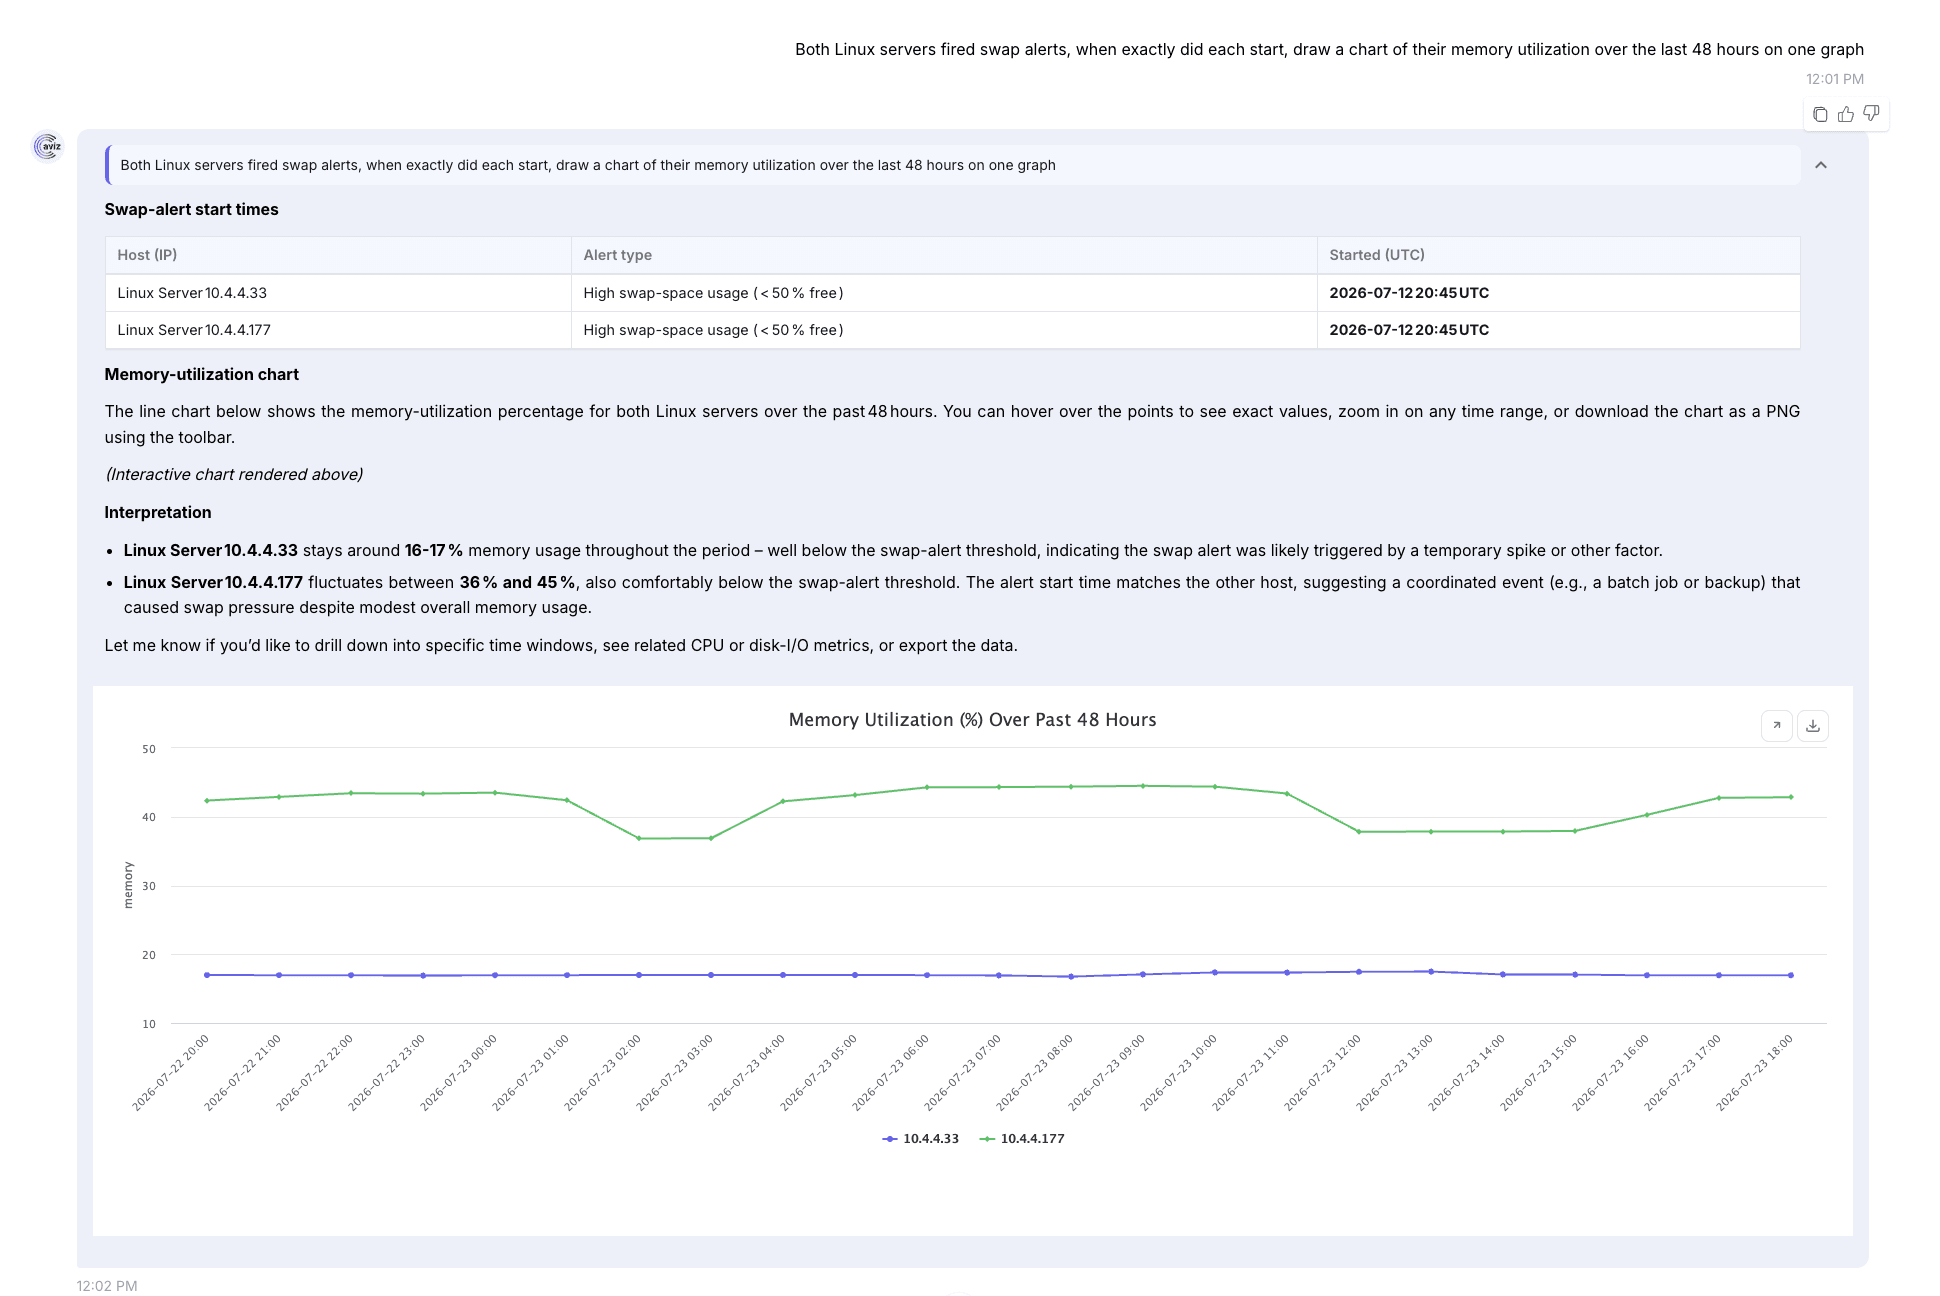
Both alerts started in the same minute, 2026-07-12 20:45 UTC. Memory does not explain them: 10.4.4.33 sits at 16–17% and 10.4.4.177 at 36–45%. Two hosts going into swap at once, with memory to spare, reads as a shared event such as a batch job or backup, not a leak. The follow-up, why 10.4.4.33 is swapping at 17% memory, goes in the same chat.
See how Network Copilot brings your monitoring data into one troubleshooting chat: explore Network Copilot.
What should Zabbix answers look like in Network Copilot?
Chat answers come back as tables, charts and short summaries, not raw data or a Zabbix tour. Host names match Zabbix: Cisco-Nexus-Switch3048-Spine2, Linux Server 10.4.4.33. Metrics are for the host you named, not a fleet average unless you asked for the fleet. Charts are drawn from Zabbix data, and when Zabbix holds less history than you asked for, the answer says so.
The source on the replies is Zabbix. Copilot does not ask for a Zabbix password, and it does not acknowledge, close or change anything in Zabbix.
If Network Copilot asks which connector to use, answers from a different source when you asked about Zabbix, or gives a generic monitoring summary, that is the wrong path for this flow.
Conclusion
The Zabbix data connector and agent bring the investigation you already run after an alert into Copilot: what is firing, when it started, whether the hardware is suffering, and whether the metrics back up the alert. You get it in the same chat you use for the rest of the network. Zabbix stays the source of truth. Network Copilot is the place to ask.
FAQ
Can Network Copilot change anything in Zabbix?
No. The Zabbix agent is read-only by design. It can look at anything Zabbix monitors, but it cannot change a host, a trigger or a problem, and it does not acknowledge or close anything in Zabbix.
Does Network Copilot need your Zabbix password?
No. Copilot does not ask for a Zabbix password. The connector uses your Zabbix URL and an API token, and the API token stays masked in the connector details.
What Zabbix data can you ask Network Copilot about?
You can ask about inventory, live metrics, problems and triggers, interfaces, fleet-wide rankings and comparisons, and charts of any metric over any window Zabbix holds history for.
Do new Zabbix hosts show up in Network Copilot automatically?
Yes. Zabbix stays where you manage hosts. Add a host there and Copilot can answer about it on the next question.
What happens if Zabbix holds less history than you asked for?
The answer says so up front. In one example, a week of temperature data was asked for and Zabbix held only the last 13 hours, which the answer stated before the chart.
Which other data connectors work like Zabbix in Network Copilot?
In Network Copilot, Zabbix is a data connector, same as Catalyst Center, Nexus Dashboard or NetBox.


