





How Does ONES Unlock Network Visibility with Buffer Monitoring and Histograms?
 November 17, 2026
 ONES & SONiC

TL;DR
Traditional monitoring averages away short moments of switch buffer congestion, even though a few milliseconds of hidden congestion on one port can hold up a job running across hundreds of servers. ONES now gives a live view of switch buffers on both SONiC and NVIDIA Cumulus Linux, covering outgoing queues, incoming traffic, reserved headroom and whole-switch usage, with every peak time-stamped. ONES 4.4 adds buffer histograms that show how long traffic actually waited, measured by the switch in hardware roughly every microsecond. Histograms are available on NVIDIA Spectrum-2 and later switches running Cumulus Linux.
Introduction
Your monitoring says the network is healthy. Links are running at 40%. Yet an AI training job is slowing down, a storage cluster is reporting delays, and nobody can say why.
Often the answer is inside the switch. Every switch has a small amount of memory, called a buffer, where packets wait when traffic spikes. When that memory fills, even for a split second, applications slow down and packets can be lost. Traditional monitoring averages these moments away, so they go unseen. This matters more than ever. AI training, distributed storage and real-time applications all depend on fast, predictable networks. A few milliseconds of hidden congestion on one port can hold up an entire job running across hundreds of servers. ONES now brings these moments into view.
How does ONES monitor switch buffers on SONiC and Cumulus?
ONES gives network teams a live view of switch buffers across both SONiC and NVIDIA Cumulus Linux, so mixed-vendor networks get one consistent picture. For every buffer, you see how full it is, how high it peaked, and exactly when.
With ONES you can:
- Spot congestion as it builds on each port and traffic type, before it turns into dropped packets.
- Protect your most sensitive traffic with early warnings for the lossless traffic that AI and storage networks depend on.
- Know how much room is left across the whole switch, for confident capacity planning.
- Connect cause and effect. Every peak is time-stamped, so you can match a buffer spike to an application complaint.
ONES covers every place a packet can wait inside the switch:
- Outgoing queues: where congestion toward a server or destination shows up first.
- Incoming traffic: which traffic is piling up as it enters the switch.
- Reserved headroom: the safety space that keeps lossless traffic from being dropped. When it starts filling, it's an early warning.
- The whole switch: total buffer use, so you know how close a switch is to its limit.
The data has always been there, but getting it out is hard. ONES does that work for you, across every switch in your network, with views from live to the last two weeks.
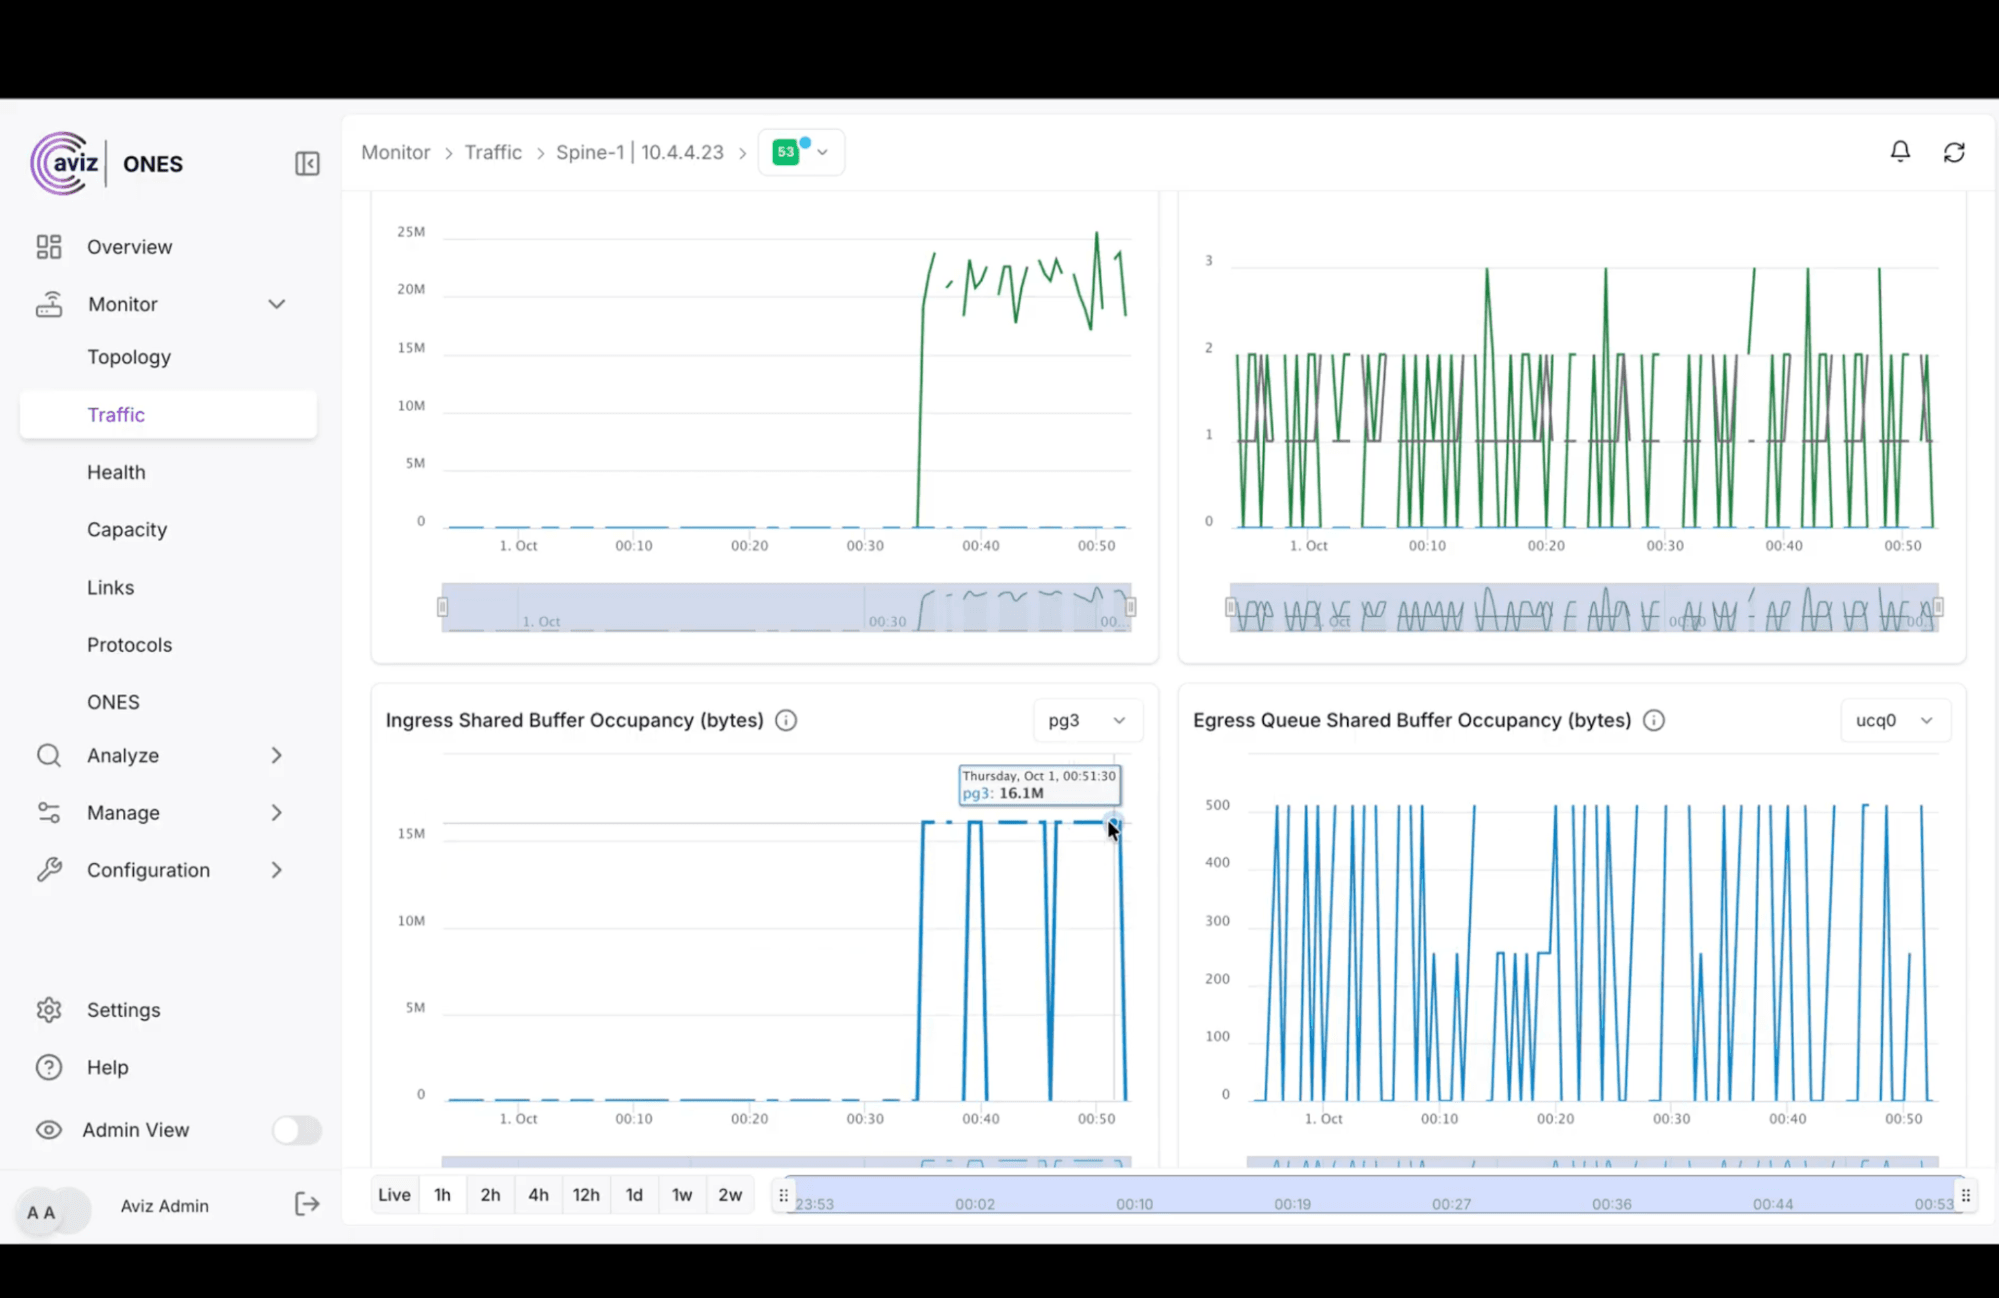
Figure-1: Buffer usage per port in ONES on a SONiC switch. A sustained spike in incoming traffic (left) stands out right away, next to the short bursts on an outgoing queue (right).
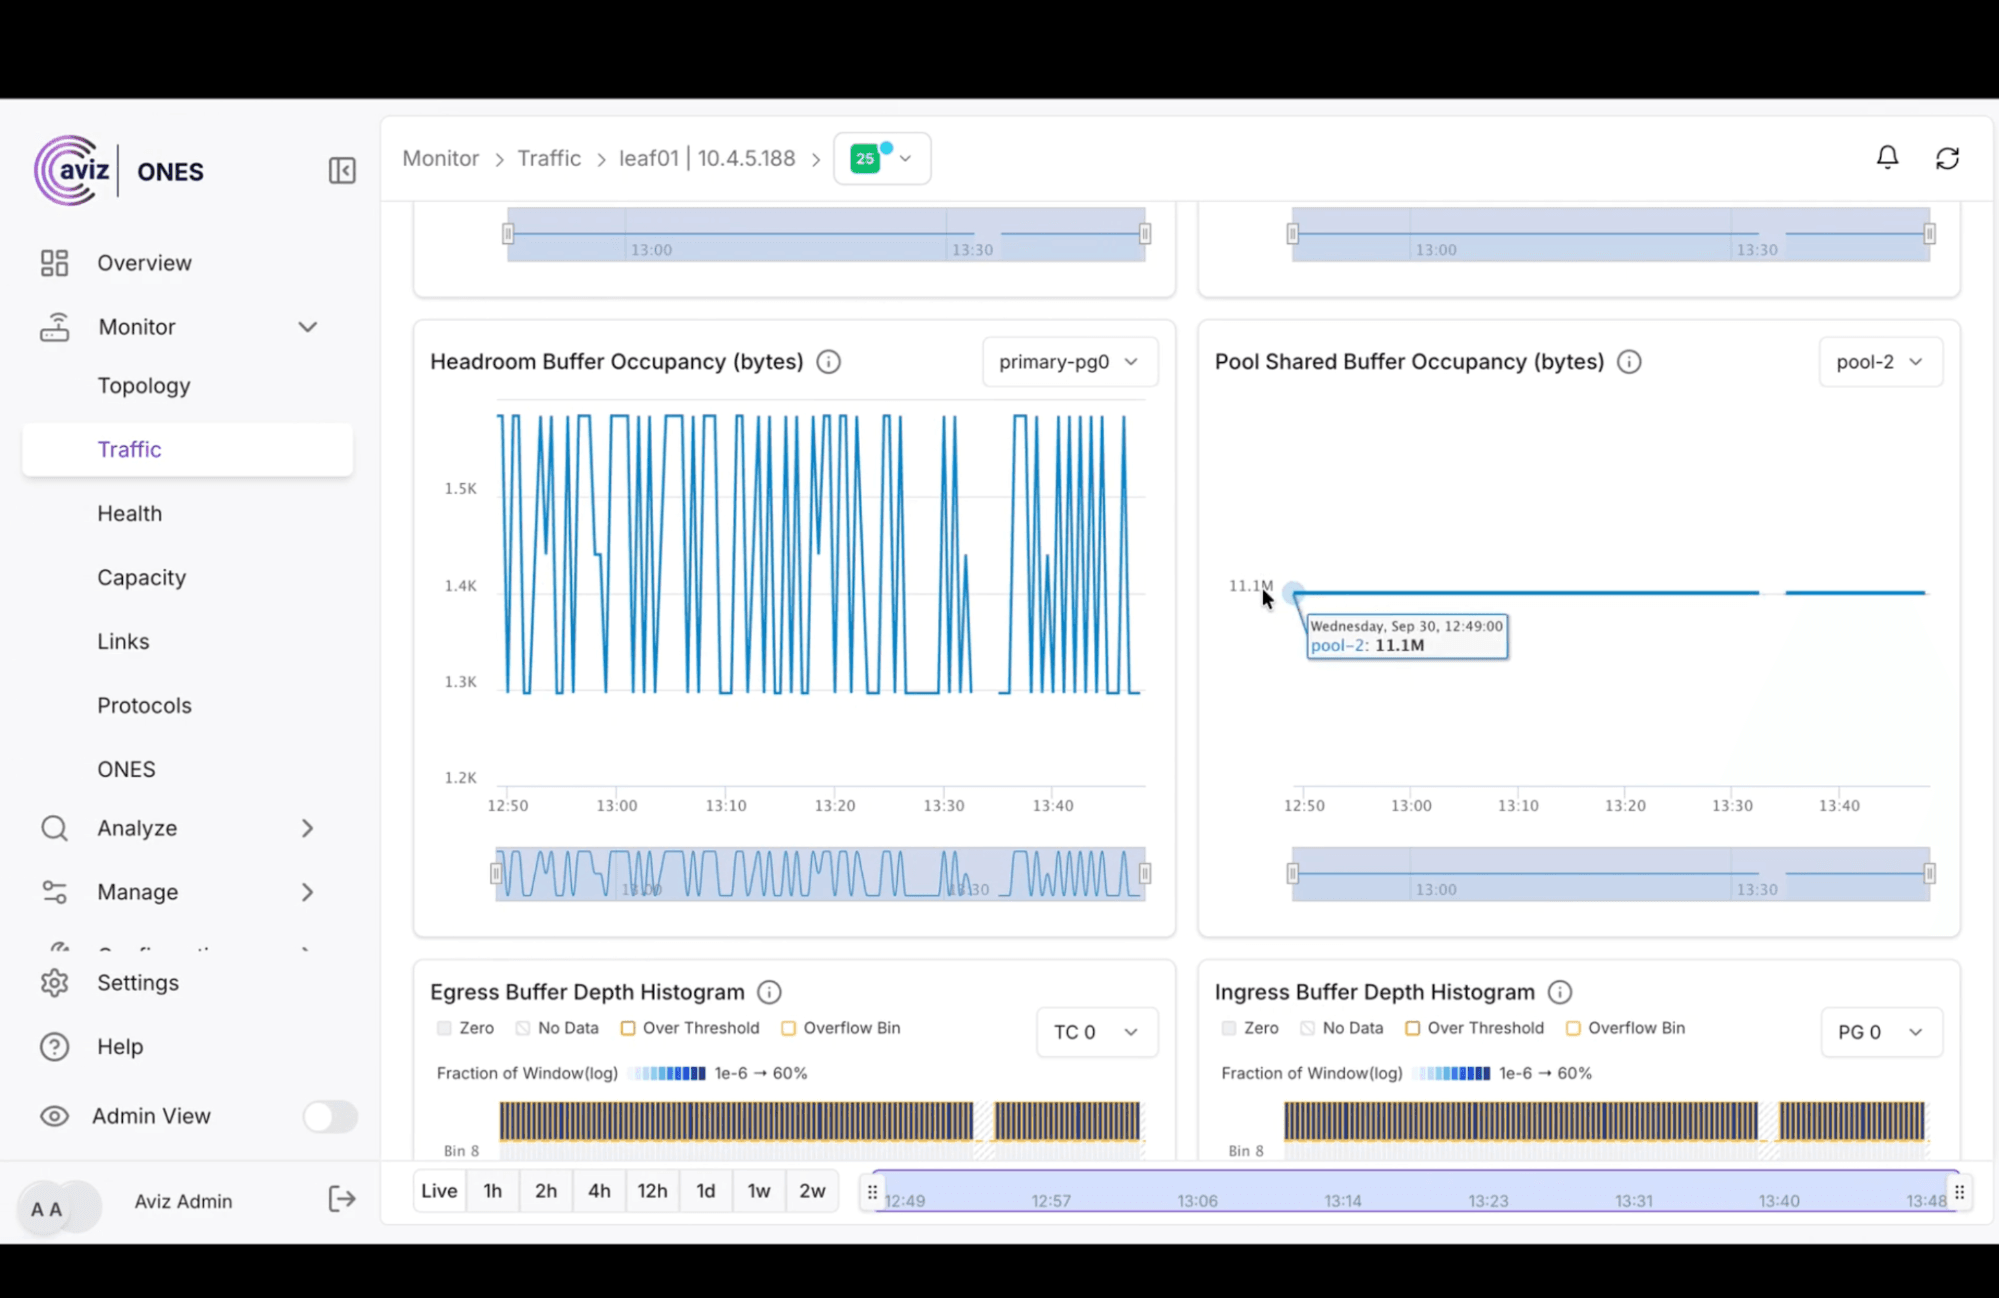
Figure-2: Headroom and per-port buffer usage on a Cumulus switch, so you can see when lossless traffic is running out of room.
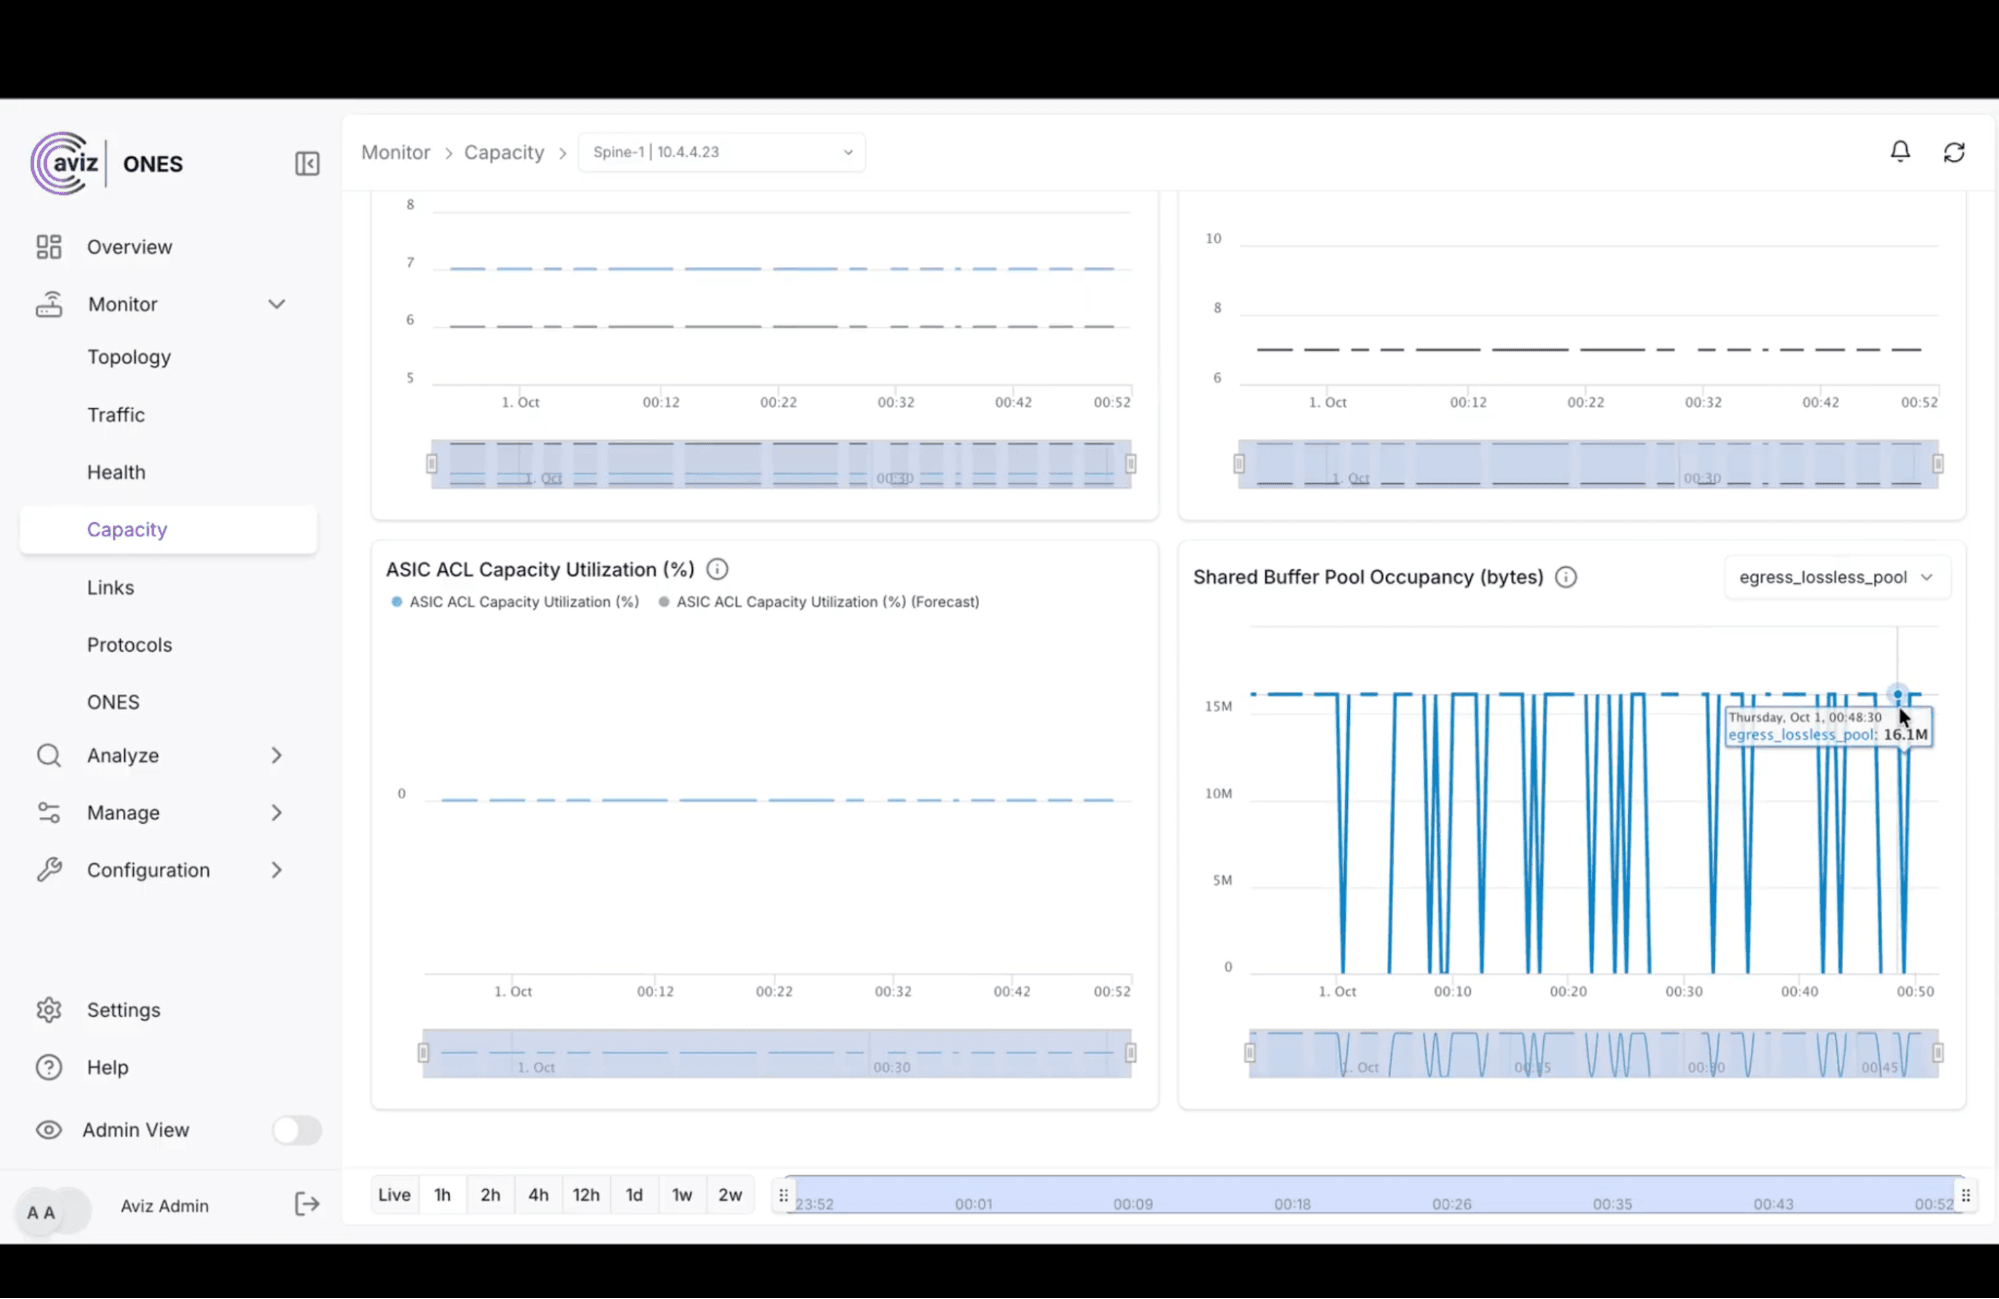
Figure-3: Switch-wide buffer usage in ONES. Hover over any point to see exactly how full the buffer was, and when.
See how Aviz ONES gives you a live view inside every switch: explore Aviz ONES.
What do buffer histograms show on Cumulus switches?
Buffer histograms in ONES 4.4 show how much time each queue spent at every fill level, from empty to full, as a heatmap, so brief blips and ongoing congestion look different at a glance.
Knowing how high a buffer peaked is useful. Knowing how long it stayed there is what tells you whether you have a problem.
Think of a checkout line. Ten people in line for a few seconds is normal. Ten people in line all afternoon means you need another register. A single "peak" number can't tell those two apart. Histograms can.
ONES 4.4 shows how much time each queue spent at every level, from empty to full, in an easy-to-read heatmap. Brief blips and ongoing congestion look completely different at a glance.
Behind the heatmap, the switch does the measuring itself, in hardware. Roughly every microsecond, it checks how full each queue is, which adds up to millions of readings every 30 seconds, so nothing slips between the gaps. ONES turns those readings into the number that matters most: how long traffic actually waited. A queue that touches its limit for a few microseconds is a harmless blip. A queue that sits there for several seconds out of every half minute is chronic congestion, quietly slowing every application on that port. A single peak value makes them look identical, but in ONES the difference is obvious.
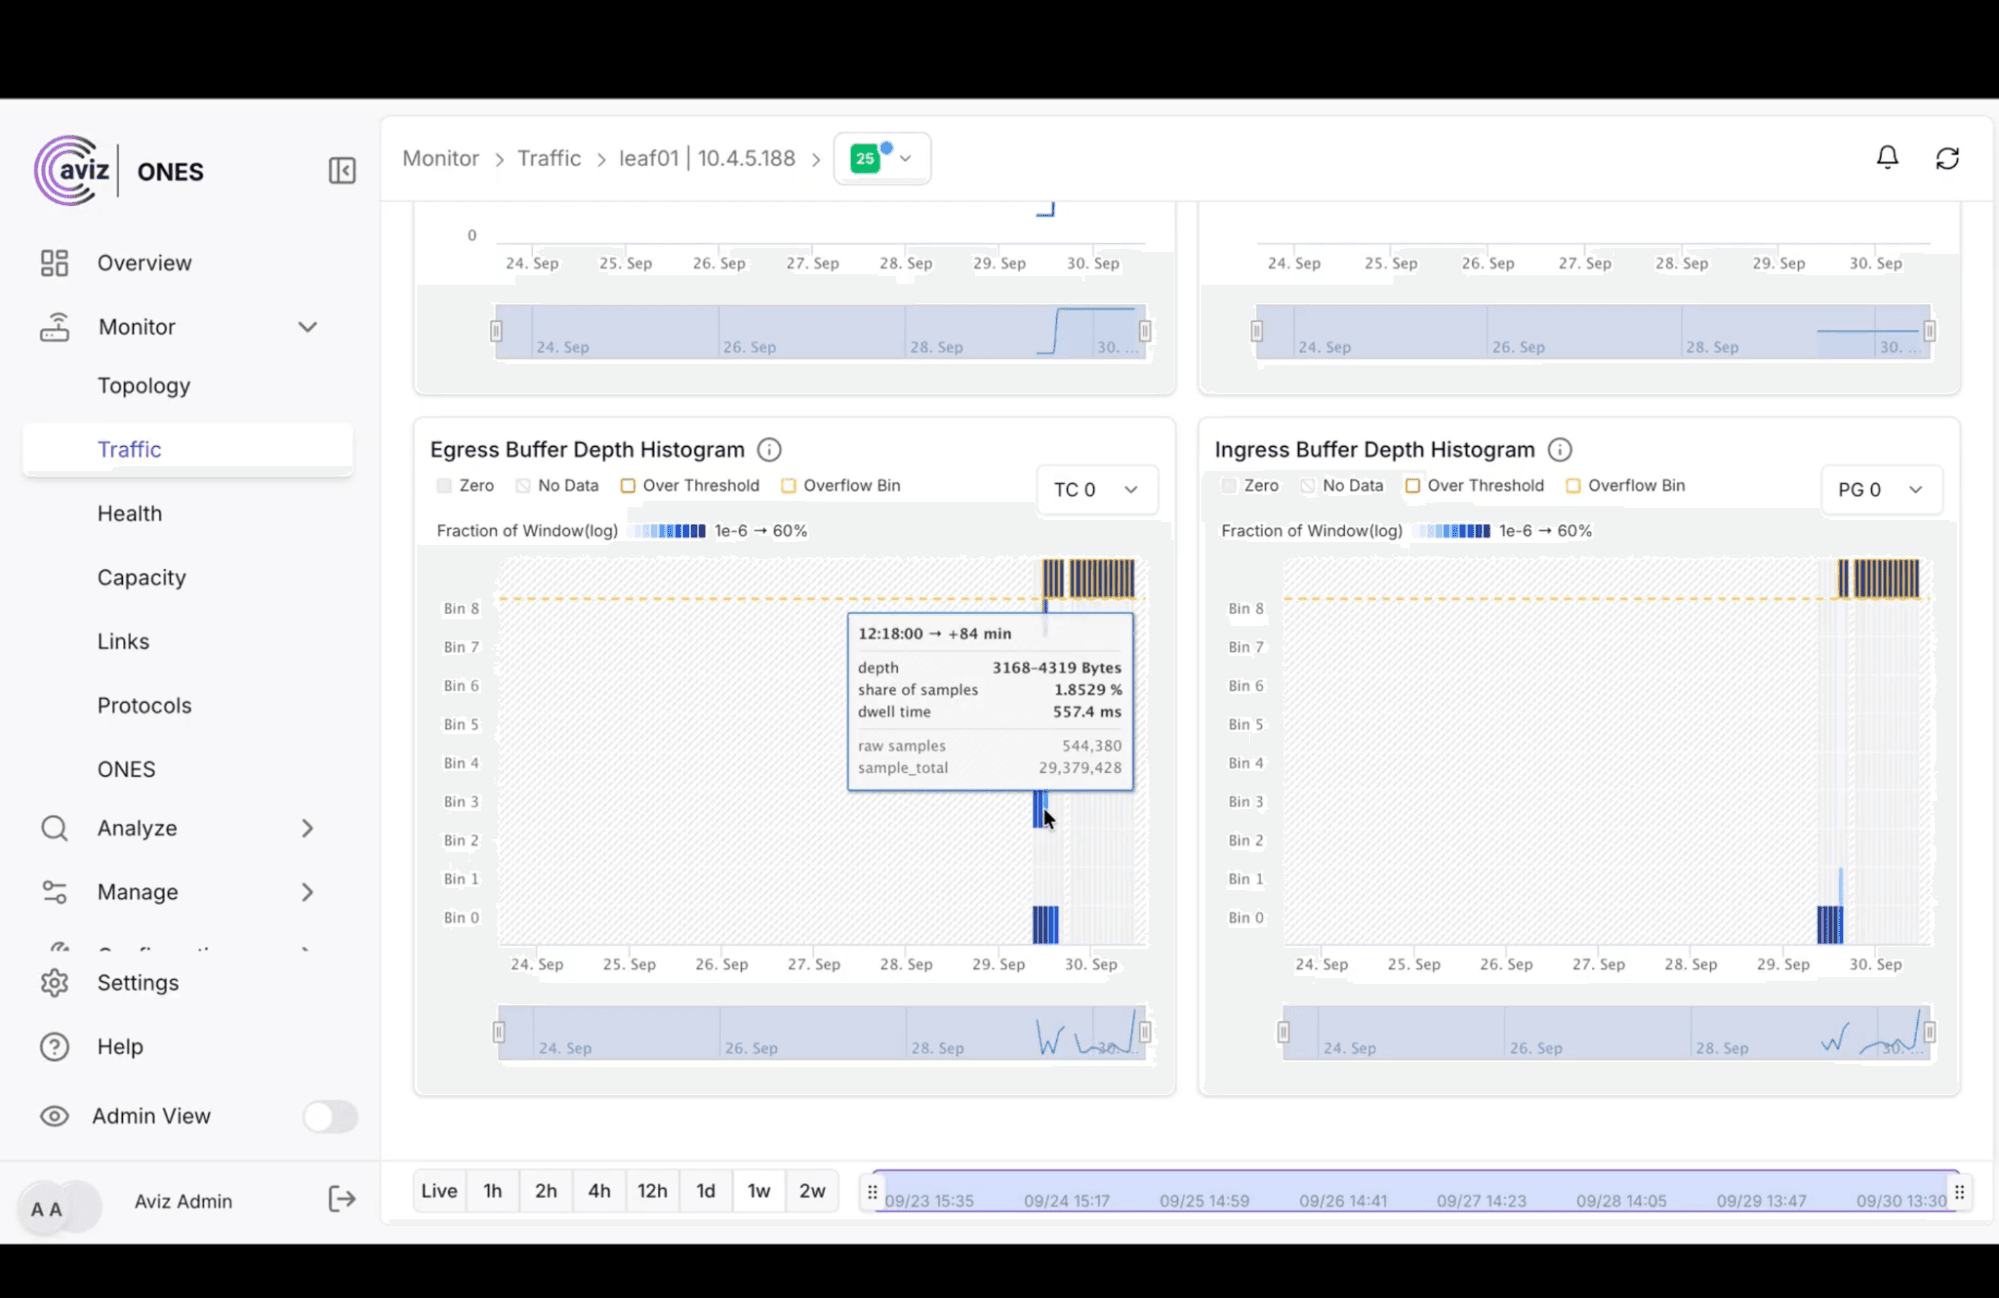
Figure-4: Buffer histograms in ONES on a Cumulus switch. Hover over any point to see how full the buffer was and how long traffic waited there.
Buffer histograms are available on NVIDIA Spectrum-2 and later switches running Cumulus Linux.
Conclusion
Buffer monitoring and histograms give a clear view inside every switch: less guessing, faster answers, and more confidence that your network is ready for demanding workloads.
Buffer monitoring is available in ONES for SONiC and Cumulus Linux, and buffer histograms are available for Cumulus.
FAQ
Why doesn't traditional network monitoring catch buffer congestion?
Traditional monitoring averages away the moments when a switch buffer fills, so links can look healthy at 40% utilization while an AI training job or storage cluster still slows down.
Which switches support buffer histograms in ONES?
Buffer histograms are available on NVIDIA Spectrum-2 and later switches running Cumulus Linux. Buffer monitoring itself is available for both SONiC and Cumulus Linux.
How often does the switch measure queue depth for buffer histograms?
The switch measures in hardware, roughly every microsecond, which adds up to millions of readings every 30 seconds, so nothing slips between the gaps.
What is reserved headroom in a switch buffer?
Reserved headroom is the safety space that keeps lossless traffic from being dropped. When it starts filling, it's an early warning.
How far back can you view buffer data in ONES?
ONES gives views from live to the last two weeks, across every switch in your network.
Can ONES show buffer usage across a mixed-vendor network?
Yes. ONES covers both SONiC and NVIDIA Cumulus Linux, so mixed-vendor networks get one consistent picture of switch buffers.


