





How Do Splunk + Network Copilot Turn Raw Telemetry Into Real Answers?
 April 20, 2026
 Network Copilot ™

TL;DR
Splunk serves as the centralized engine for collecting and analyzing network telemetry, while Network Copilot adds an AI layer that translates natural-language queries into actionable insights. Together, they turn complex data into clear answers, enabling faster troubleshooting, real-time visibility, and more proactive network operations at scale.
Introduction
Modern network teams are drowning in telemetry but still lack fast answers. Logs, flows, and device events live in multiple tools, while operators need immediate answers to questions like: “What changed, where did it change, and what should I do next?” Splunk and Network Copilot together close that gap. Teams need real-time visibility, AI-driven insights, and actionable analytics to ensure high availability and performance.
This white paper explores the integration of Splunk, the industry-leading operational intelligence platform, with Aviz Network Copilot (NCP), an AI-powered assistant for network operations.
By combining Splunk’s data ingestion, indexing, and real-time analytics with Network Copilot’s AI-driven reasoning and predictive insights, enterprises can unlock faster troubleshooting, proactive optimization, and reduced downtime across multi-vendor environments.
What is the overview of Splunk and Network Copilot integration?
AI assistants such as Network Copilot are transforming how enterprises interact with their infrastructure by turning raw telemetry into human-readable insights. In this architecture, Splunk remains the system of record for operational telemetry, while Network Copilot serves as the reasoning and interaction layer. It translates natural language questions into structured Splunk queries, retrieves relevant results, and delivers summarized insights, charts, and recommendations to operators.
Splunk complements this model by providing:
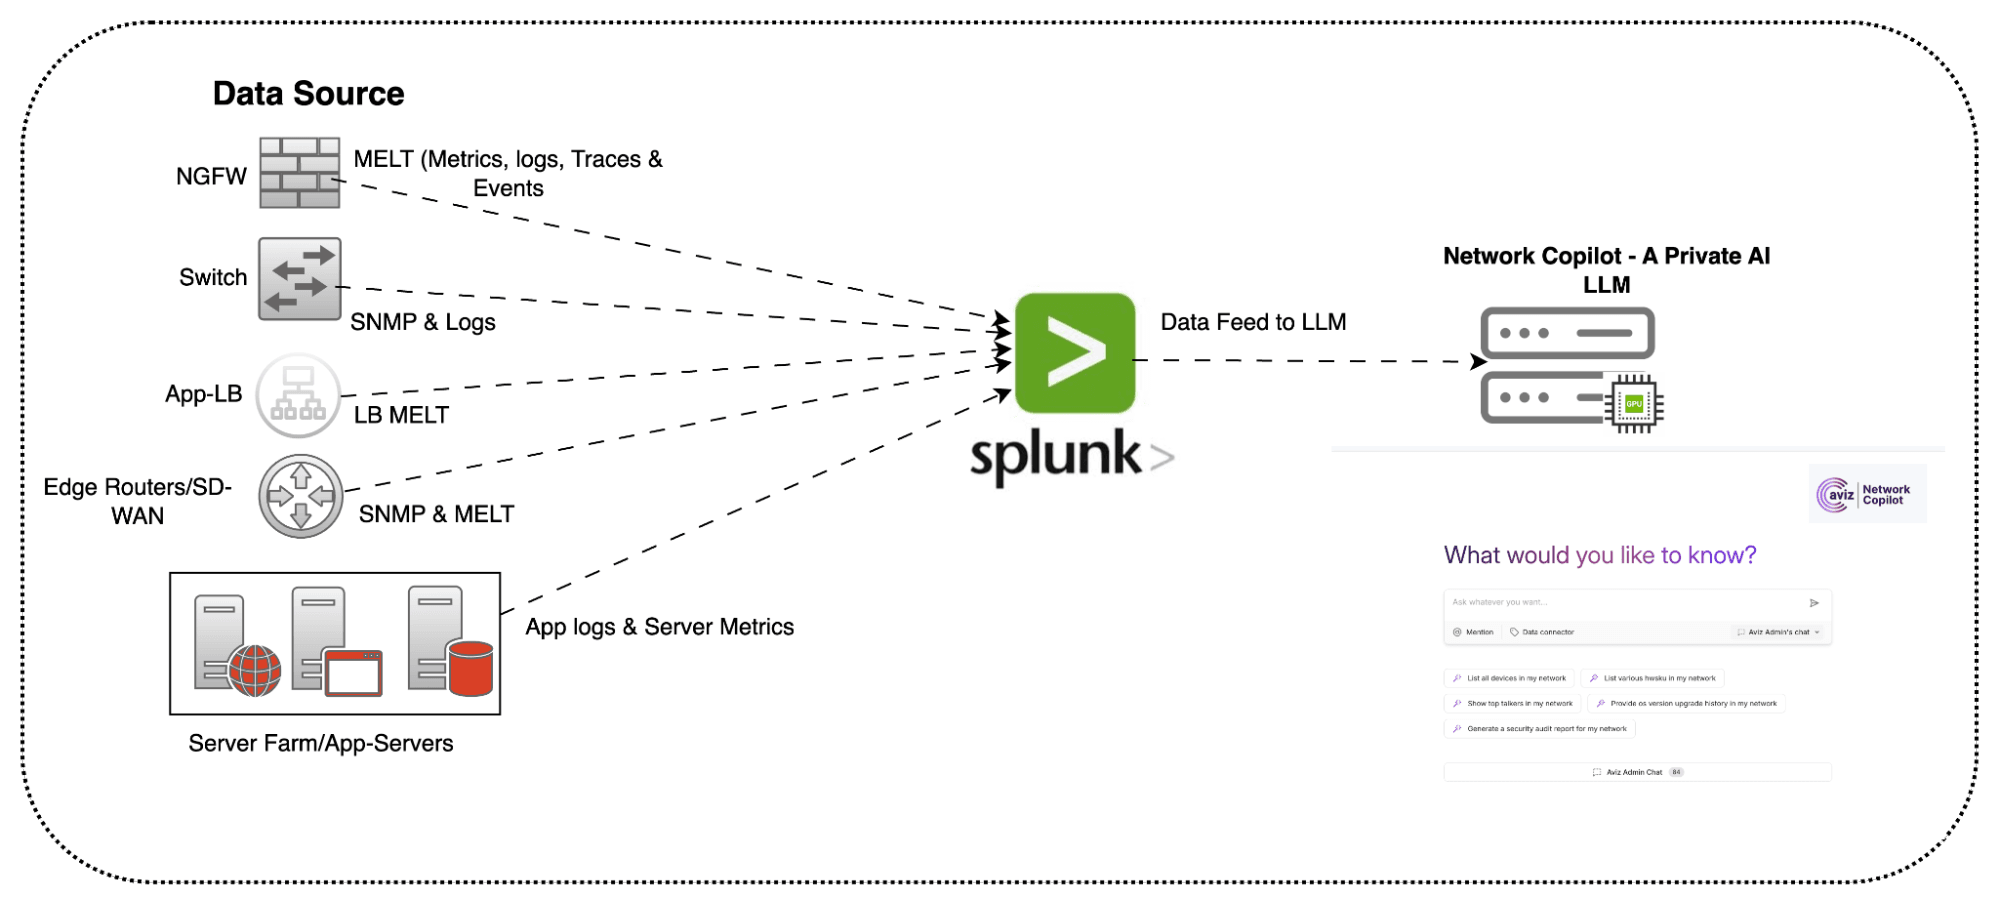
- Centralized data visibility: logs, metrics, flows, and security events.
- Real-time analytics: anomaly detection, dashboards, and alerting.
- Operational context: structured enterprise data that enriches AI-driven analysis.
When integrated, Splunk acts as the data foundation, while Network Copilot serves as the reasoning layer, turning raw telemetry into intuitive operational insights like “Which interfaces on my Cisco ASR1001 are experiencing packet drops in the last 15 minutes?”
What are the key benefits of integration?
How does enhanced data visibility help?
Splunk collects logs and telemetry from routers, switches, firewalls, and servers. By making this indexed data available to Network Copilot, NCP can answer natural language queries such as:
“Show me top talkers across WAN routers in San Jose.”
“List interfaces with CRC errors above threshold.”
How does real-time analytics and alerting improve operations?
Splunk’s real-time analytics and alerting capabilities let Network Copilot surface anomalies such as sustained high CPU usage on a Cisco ASR1001 control processor and suggest next steps for investigation or remediation.
How do forecasting failures and machine learning add value?
Network Copilot applies machine learning to Splunk data to help identify early warning signals, such as:
- Capacity constraints on core routers.
- Potential security breaches flagged by SIEM logs.
How does the integration architecture work?
What is the Splunk reference flow?
- Data Ingestion: Logs, metrics, and NetFlow/sFlow/Firewall logs are collected via Splunk
- Forwarders: Indexing & Search: Data indexed in Splunk, queryable using SPL.
- AI Integration Layer: Network Copilot queries Splunk APIs for contextual answers.
- Processing & AI Reasoning: NCP applies LLM-driven reasoning and machine-learning pipelines to high-volume network telemetry, transforming Splunk search results into contextual insights, summaries, and recommended actions.
- Streaming to Kafka: Enriched events flow into Kafka for scalable persistence and downstream actions.
What use cases does this integration support?
Use Cases
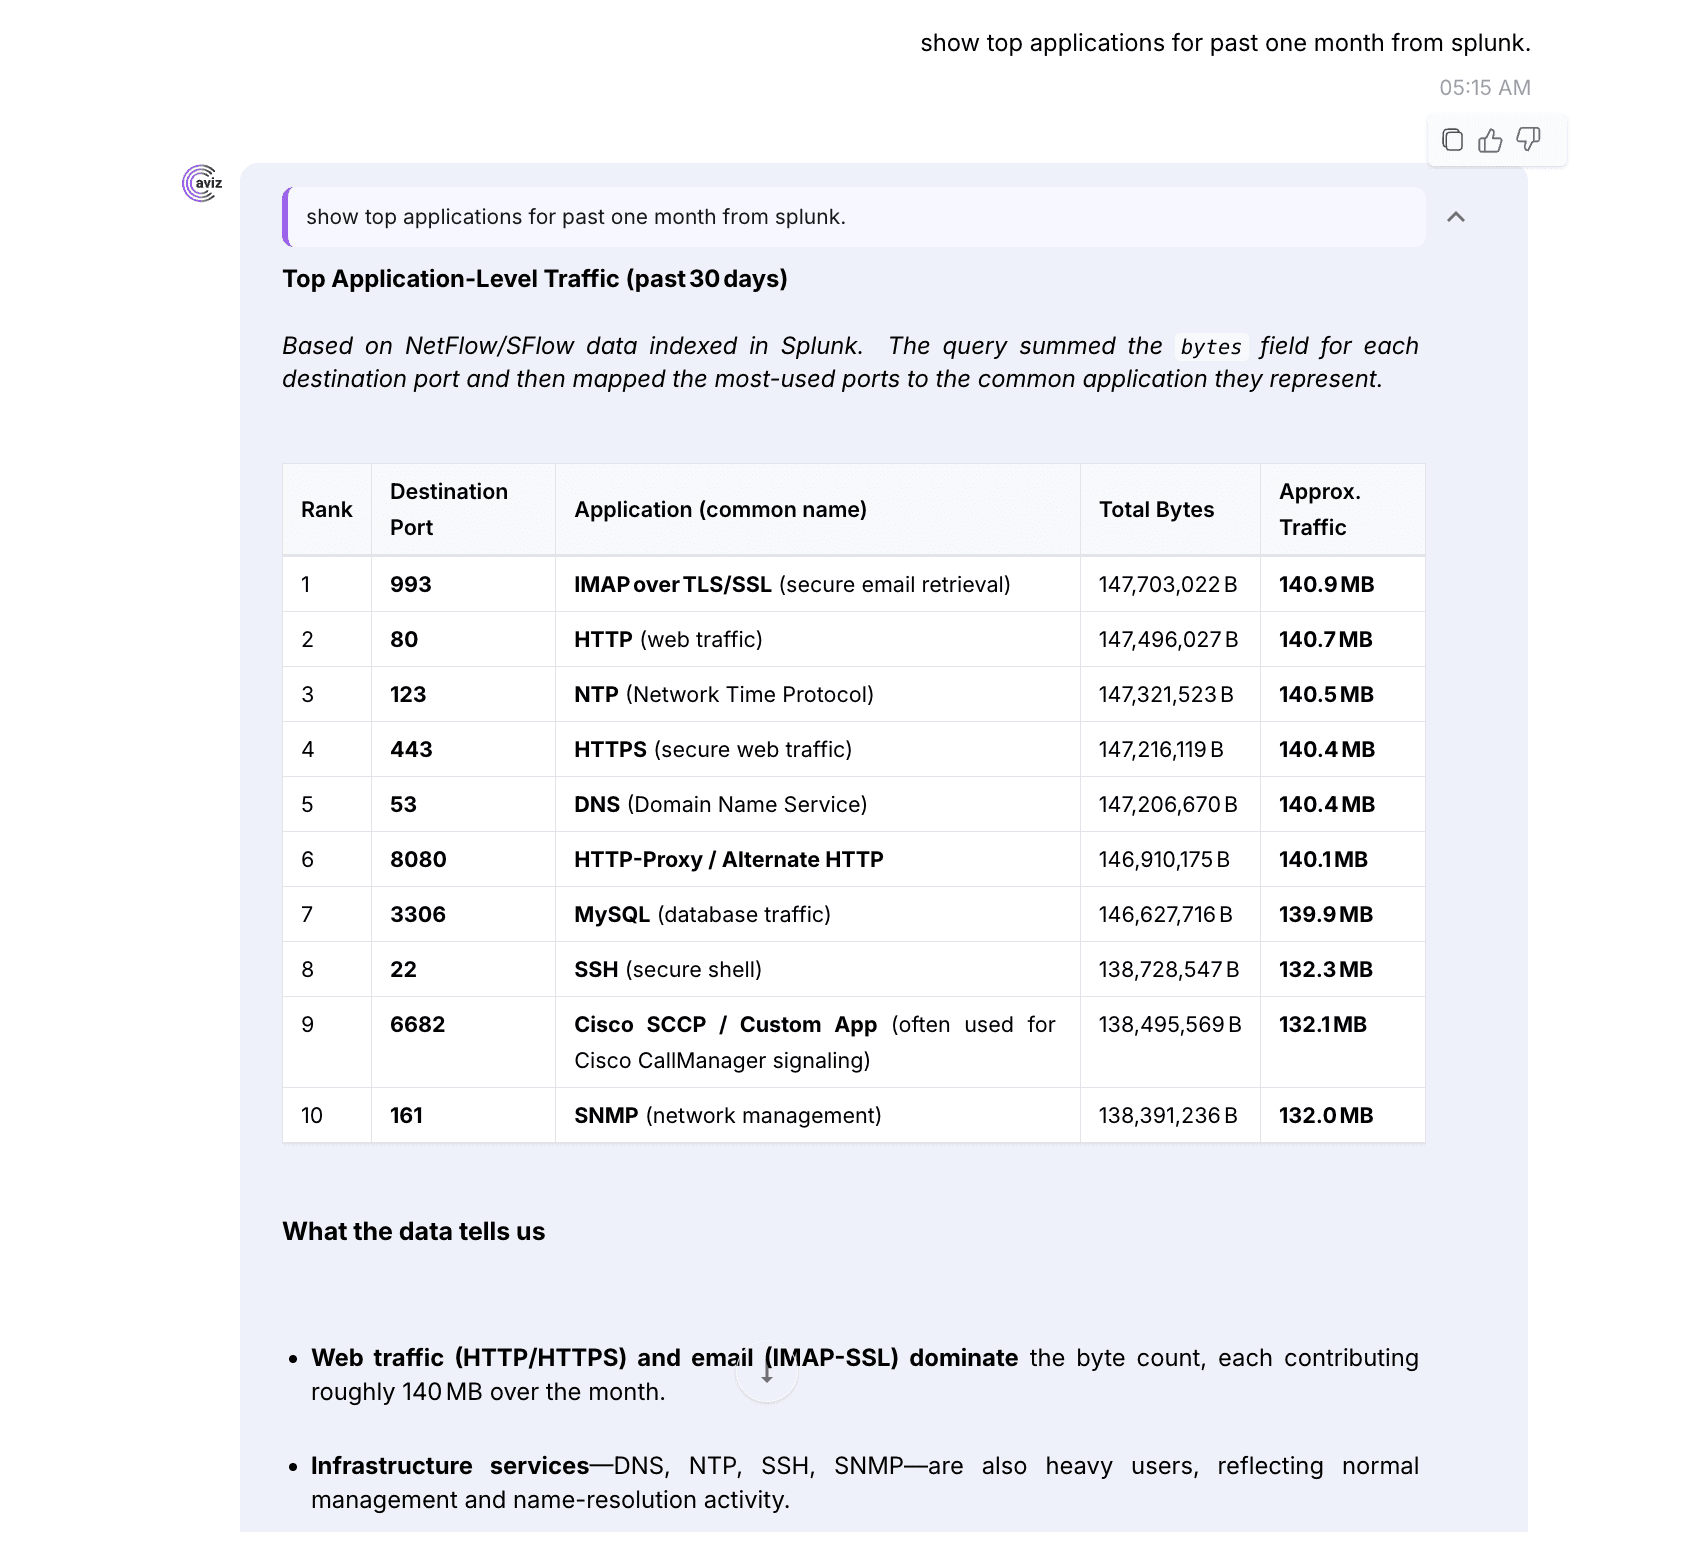
1. Network Monitoring & Insights: How top talkers from last month
- Identify top talkers, applications, and anomalies across hybrid cloud and on-prem routers.
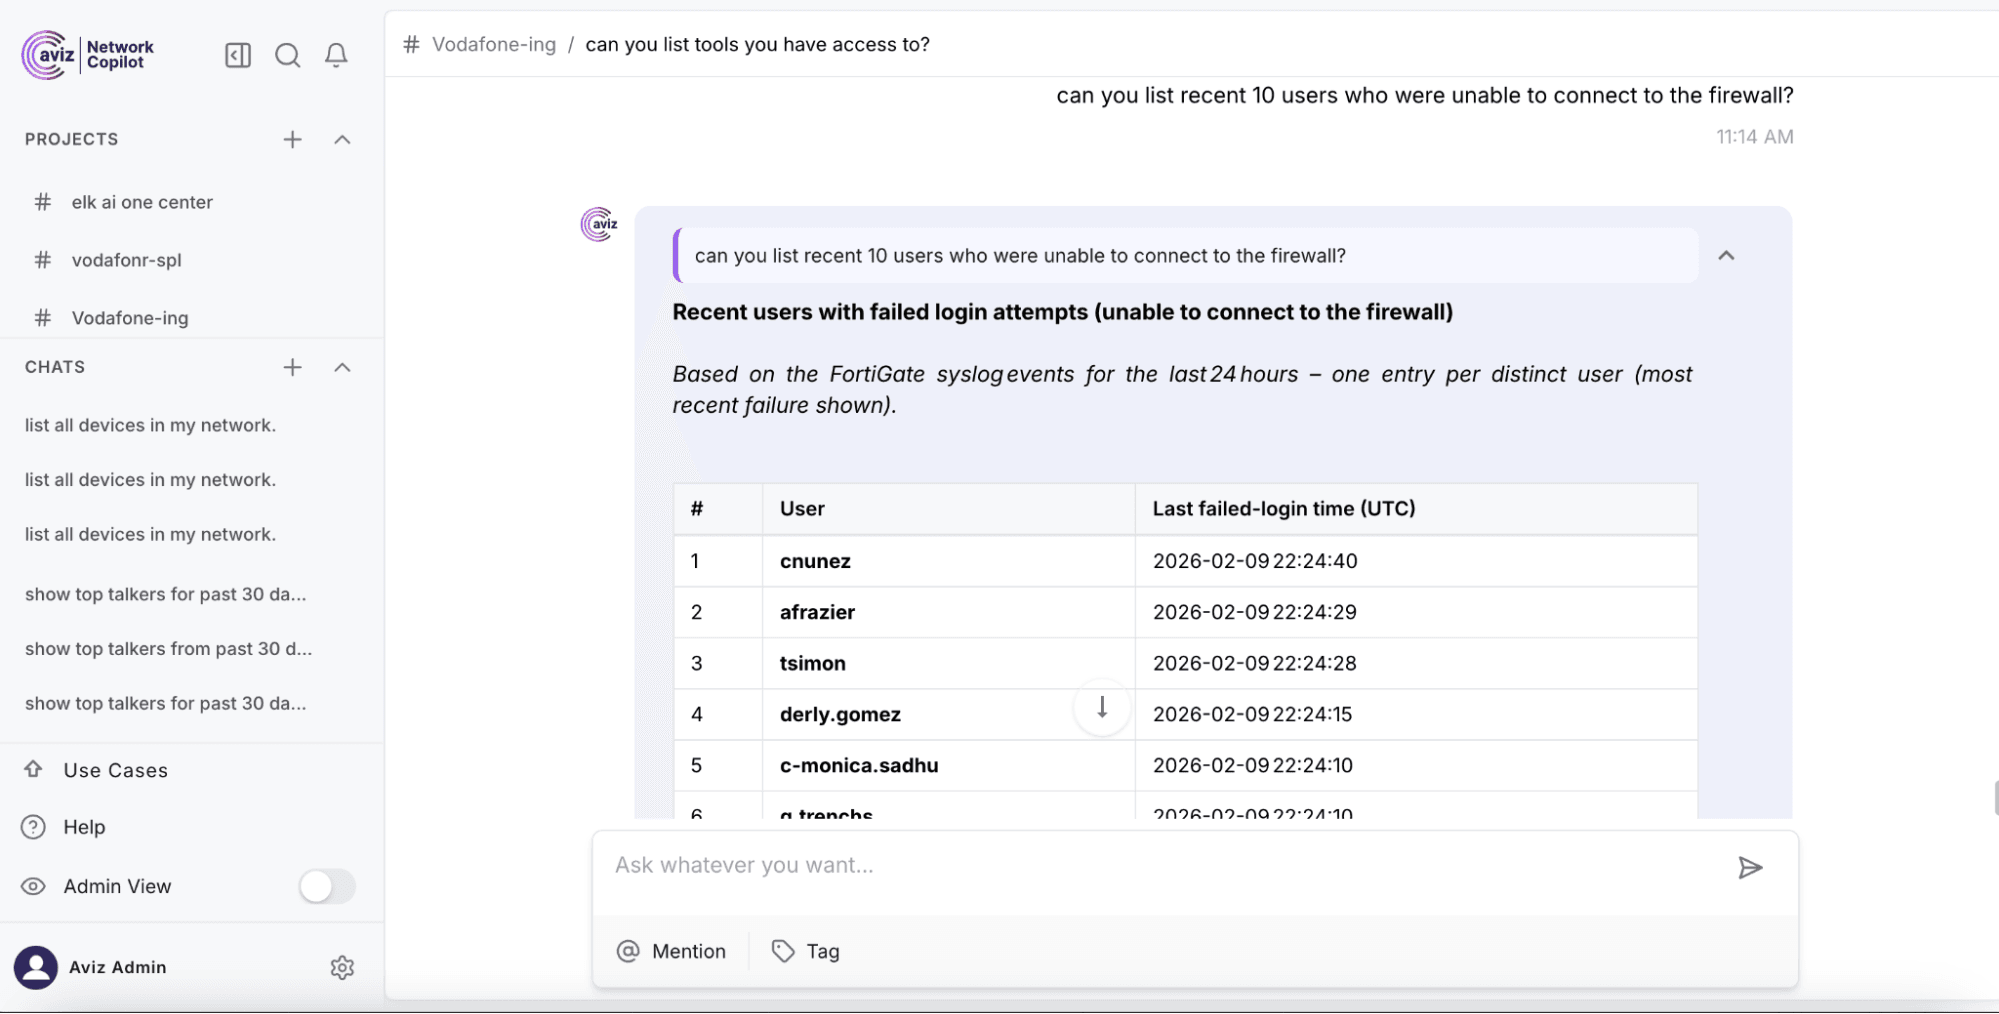
2. Security Operations: Sec admin identifying recent user activity connected to Firewall
- Sec admin identifying recent user activity connected to Firewall.
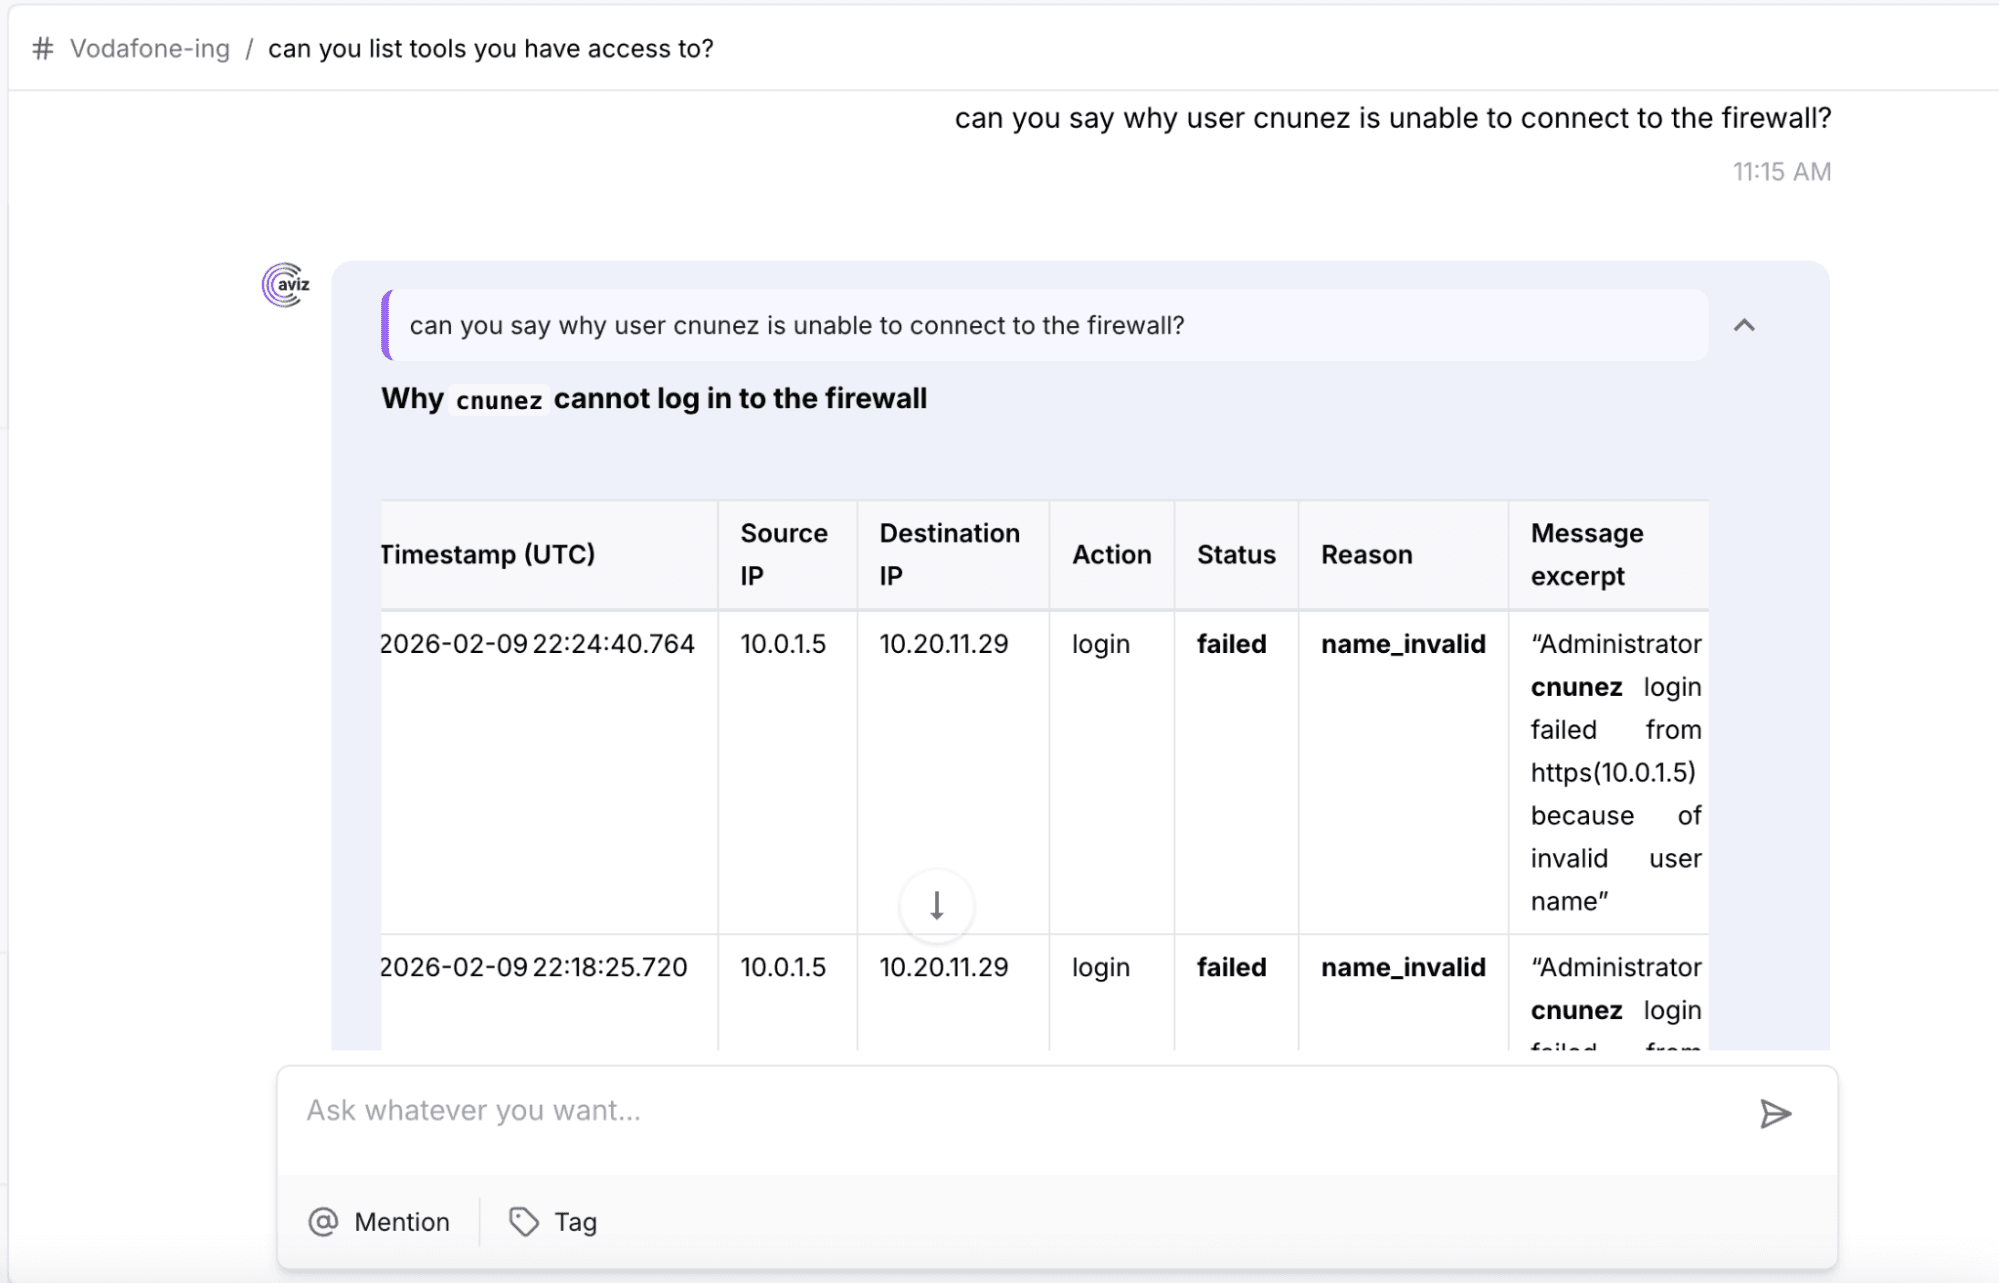
3. Security & Compliance: Tracking failed login attempts to firewall
- Integrate Splunk SIEM with Network Copilot to detect DoS attacks, anomalous traffic, or policy violations.
4. Flow analytics and summaries
- “What were the top applications consuming WAN bandwidth last week?”
- “Plot BW utilization by hardware SKU.”
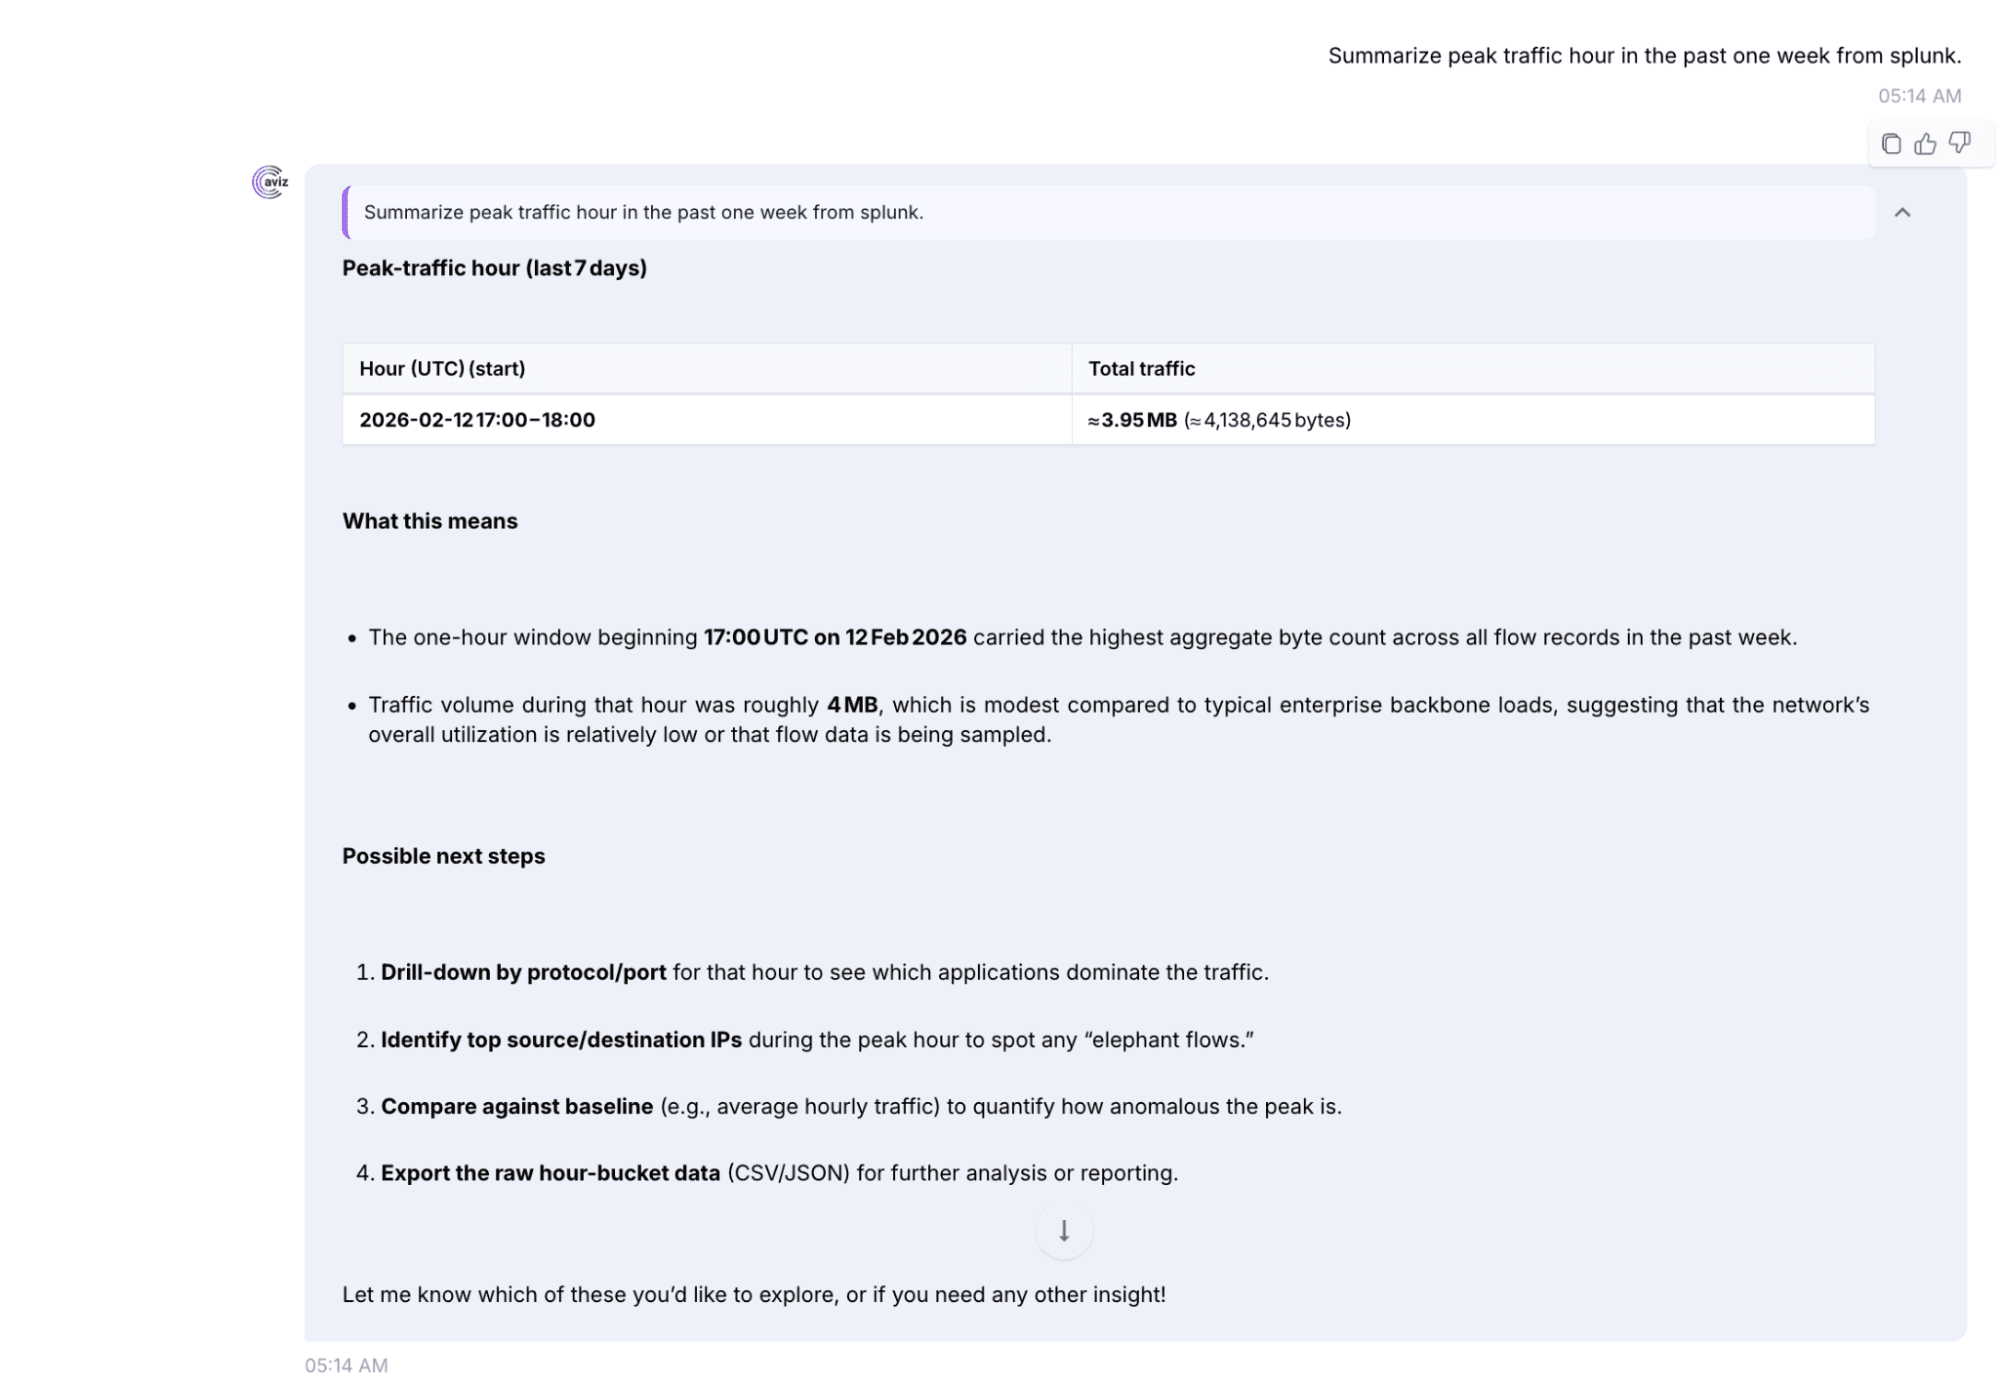
With Network Copilot’s chat interface, these queries produce both tables and charts for faster analysis.
Challenges and Solutions
- Duplicate Events → handled via checkpoints, event IDs, and hashing.
- Scalability Bottlenecks → solved with Kafka-based queuing and multi-threaded collectors.
- Security Risks → mitigated by token-based authentication and encrypted pipelines.
How does Splunk perform at scale for AI-driven network analytics?
We tested the integration against real network flow data at four scales 50 flows (baseline), 1 million, 5 million, and 10 million flows running on Splunk 9.x Enterprise with a single search head and two indexers. These results are based on representative testing and may vary depending on infrastructure sizing, data characteristics, query complexity, and model inference latency.
How fast is Splunk itself?
Direct SPL queries remain fast even at scale. Simple lookups and time-filtered searches stay under half a second at 5M flows. Stats aggregations take 2–4 seconds. The most expensive operation is field extraction combined with aggregation (parsing unstructured fields at query time), which reaches 8–15 seconds at 5M, though this drops to under 300ms with tstats and data model acceleration.
The takeaway: Splunk itself is not the bottleneck.
How fast is the full AI pipeline?
The end-to-end path from a user’s natural language question through the orchestrator, Splunk agent, MCP layer, Splunk query, and back to a formatted answer is designed to minimize unnecessary LLM iterations while maintaining accuracy.
At 1 million flows, the total response time ranges from 5 to 10 seconds. Splunk query execution takes 1–5 seconds, MCP overhead is negligible at 0.2–0.5 seconds, and the remaining time is LLM inference (query routing, schema discovery, SPL construction, result interpretation, and response generation).
What are real query patterns and what do they cost?
The fastest pattern is time-based filtering (e.g., "Show firewall events from the last hour") 120ms query time at 1M, 300ms at 5M, with total agent time of 12–14 seconds. The agent resolves these in fewer LLM calls since the SPL construction is straightforward.
Top talkers and protocol distribution queries are the most expensive because they require full-scan aggregations with field extraction 2–2.5 seconds query time at 1M growing to 8–12 seconds at 5M, with total agent time of 15 seconds.
Security queries like denied connection lookups fall in the middle simple filter conditions keep Splunk fast (400ms at 1M, 1.5–2s at 5M) while total agent time stays around 10 seconds.
When should optimization be done?
Below 100K flows, everything works out of the box with sub-5-second responses. Between 100K and 1M, enforcing time ranges in SPL keeps things comfortable at 15–35 seconds. From 1M to 5M, data model acceleration and tstats become important they can cut aggregation times by 10–50x. Beyond 5M flows, summary indexing, report acceleration, and dedicated search heads are recommended.
On the agent side, NCP’s proactive context discovery already caches schema and connector metadata to reduce the number of LLM iterations per query. This directly targets inference latency the largest contributor to total response time and continues to improve as the platform matures. Future optimizations include smarter query plan reuse and tighter time-range enforcement at the agent level.
Conclusion
The Splunk + Network Copilot integration provides a scalable approach to network visibility, analytics, and operational automation. Enterprises benefit from:
- Faster troubleshooting with AI-driven context.
- Reduced downtime via predictive insights.
- Optimized operations across multi-vendor environments.
- Actionable security intelligence at scale.
By unifying Splunk’s operational data with NCP’s AI reasoning, teams can move from reactive monitoring to more proactive and increasingly automated network operations.
Frequently Asked Questions
1. How do Splunk and Network Copilot work together to answer network questions?
Splunk acts as the centralized system for collecting, indexing, and analyzing network telemetry, while Network Copilot adds an AI reasoning layer that converts natural-language questions into structured Splunk queries and returns summarized insights, charts, and recommendations.
2. What problem does the Splunk and Network Copilot integration solve for network teams?
The integration addresses the challenge of large volumes of distributed telemetry by providing real-time visibility, faster answers, and actionable insights across logs, flows, and device events without manual query building.
3. What types of network telemetry are analyzed using Splunk and Network Copilot?
Splunk ingests logs, metrics, NetFlow, sFlow, firewall events, and security data from routers, switches, firewalls, and servers, which Network Copilot analyzes to generate operational and security insights.
4. How does natural-language querying work with Network Copilot?
Network Copilot translates operator questions into Splunk SPL queries, retrieves relevant results through Splunk APIs, and applies LLM-driven reasoning to produce contextual summaries, visualizations, and recommended actions.
5. What are the key benefits of integrating Splunk with Network Copilot?
Key benefits include faster troubleshooting, proactive optimization, predictive insights using machine learning, reduced downtime, real-time anomaly detection, and scalable analytics across multi-vendor environments.
6. How does the integration support proactive network operations?
Machine-learning models applied to Splunk data help identify early warning signals such as capacity constraints, sustained CPU usage, and potential security threats before service impact occurs.
7. What role does Splunk play in AI-driven network operations?
Splunk serves as the system of record by ingesting and indexing operational telemetry while providing real-time analytics, dashboards, alerting, and structured data for AI-driven analysis.
8. What role does Network Copilot play in the integration architecture?
Network Copilot functions as the reasoning and interaction layer, applying LLM-based analysis and machine learning to transform Splunk search results into human-readable insights and recommended actions.
9. What network and security use cases are supported by the integration?
Supported use cases include network monitoring, top-talker analysis, bandwidth utilization, flow analytics, firewall activity tracking, failed login monitoring, DoS detection, and policy violation identification.
10. How does the Splunk reference flow enable scalable analytics?
The flow includes data ingestion via Splunk forwarders, indexing and SPL search, AI querying through Network Copilot APIs, LLM-based reasoning, and Kafka streaming for scalable persistence and downstream processing.
Explore Splunk + Network Copilot to enable faster, AI-driven network operations.


