





How Can a Unified Dashboard Simplify Network Copilot Analytics and Visibility?
 April 22, 2026
 Network Copilot ™

TL;DR
- Dashboard Analytics brings all Network Copilot metrics into one unified view, eliminating fragmented insights.
- It helps teams track adoption, monitor activity, and make faster data-driven decisions with minimal effort.
Introduction
Network Copilot generates activity across multiple components—models, agents, data connectors, and user interactions. Monitoring each of these individually can quickly become time-consuming and complex. The Dashboard Analytics feature simplifies this by bringing all key platform metrics into a single, intuitive interface. With visual charts and summary indicators, users can instantly understand platform adoption, usage trends, system activity, resource utilization, and overall operational performance.
Why It Matters
As activity grows across the platform, it becomes harder to see the bigger picture. Disconnected data can slow down decision-making and hide important signals. Dashboard Analytics eliminates this fragmentation by transforming scattered information into clear, actionable insights.
How It Helps
- Instantly understand platform adoption and usage
- Spot trends and issues before they escalate
- Reduce time spent on manual analysis
- Make faster, data-driven decisions
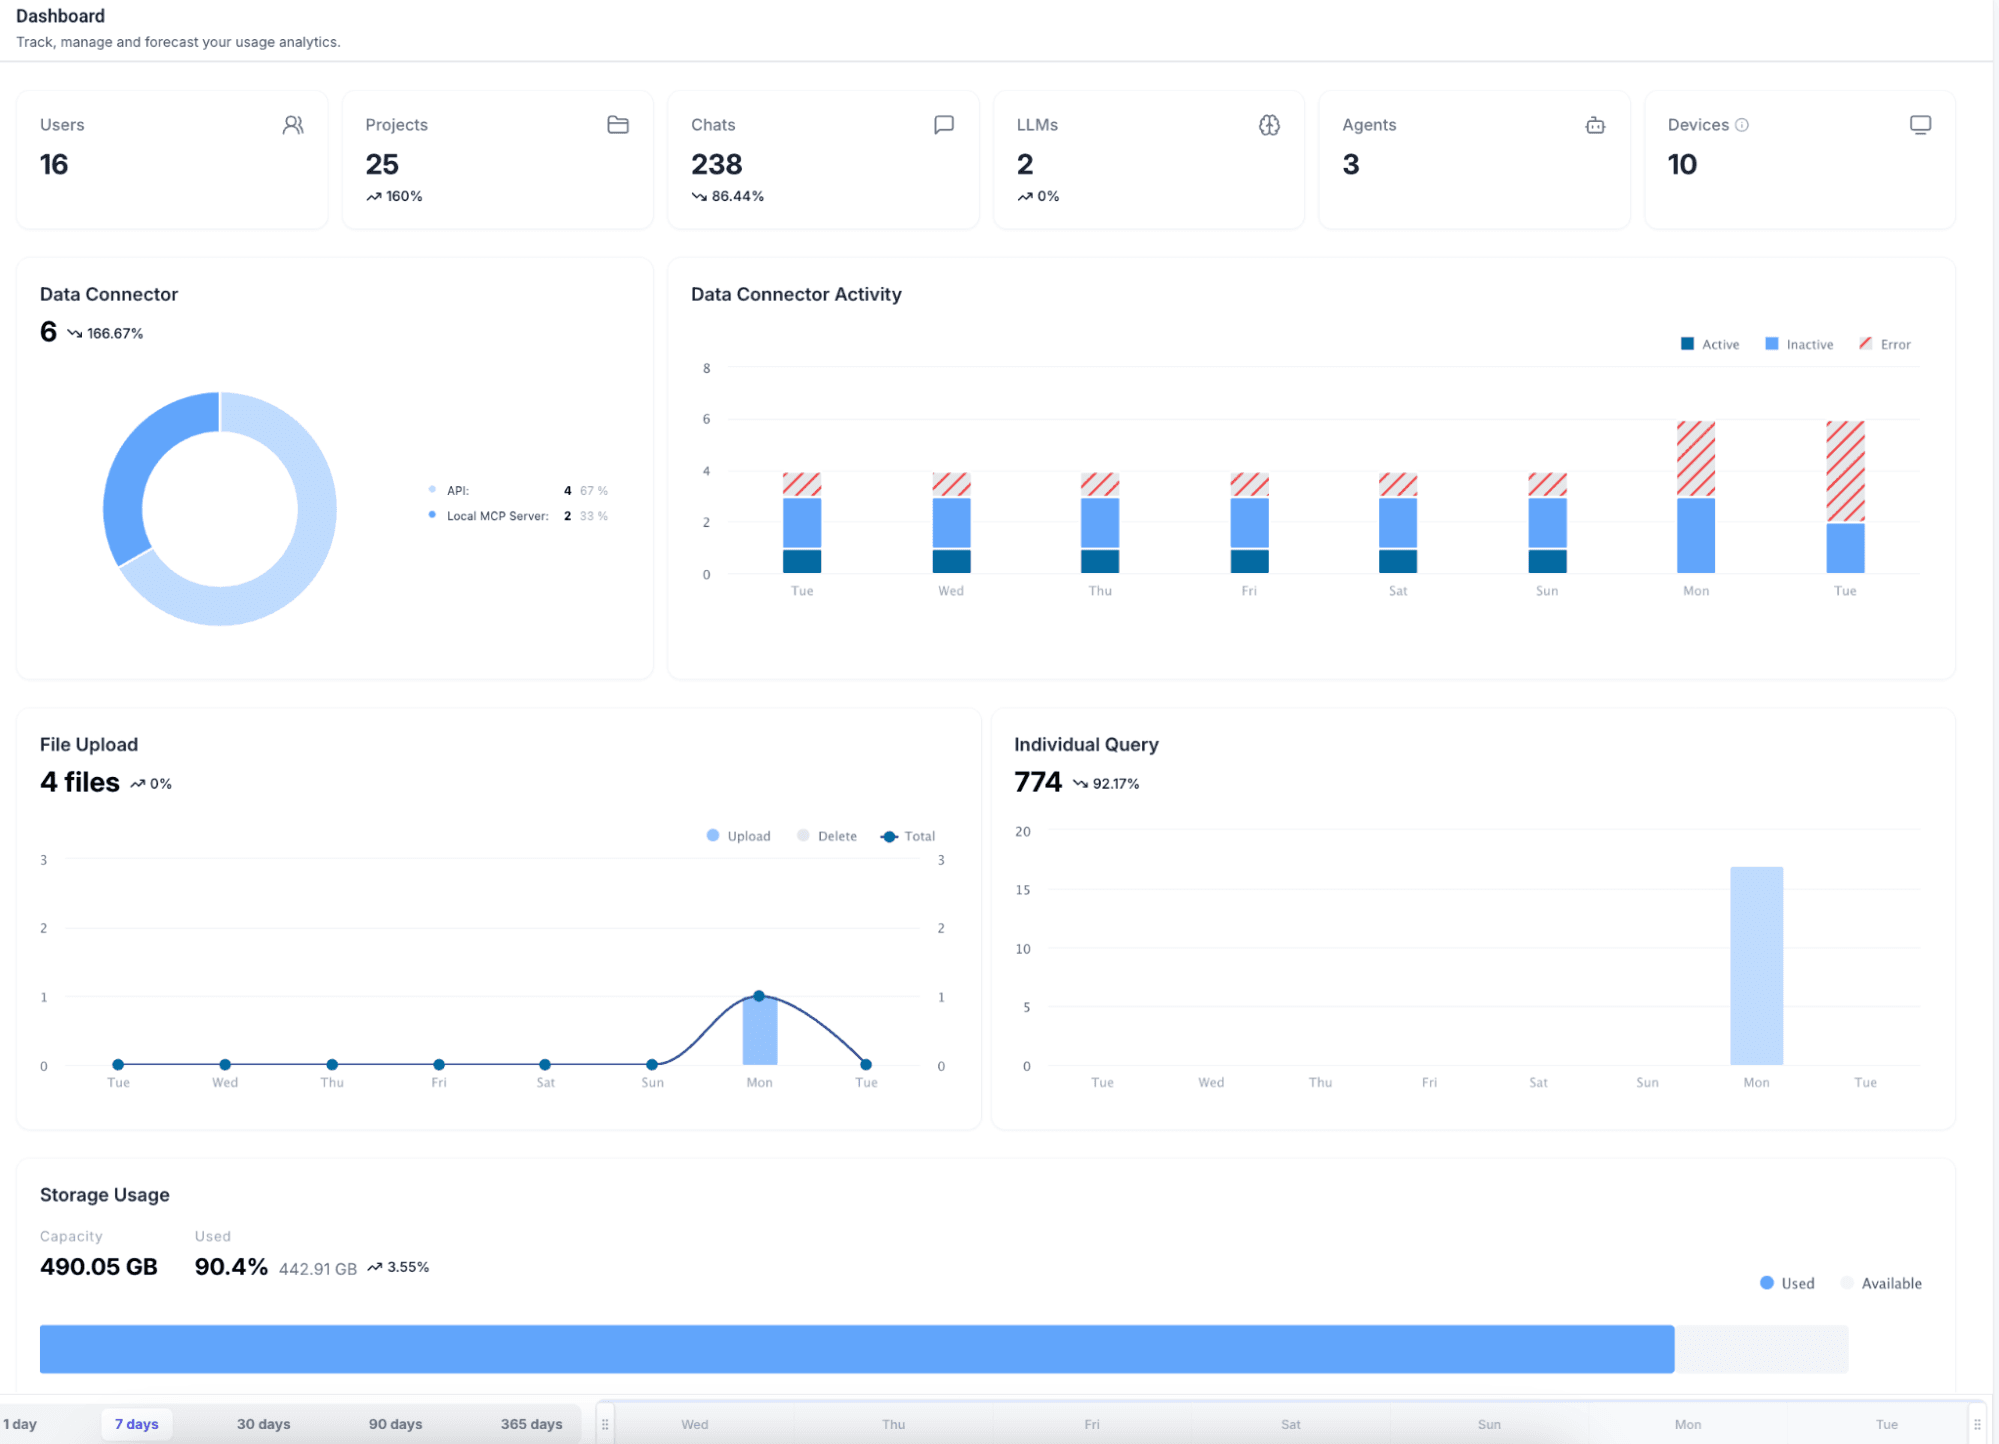
This unified view enables teams to make faster, data-driven decisions about how their AI infrastructure is being used.
What Key Platform Metrics Can You Track at a Glance?
At the top of the dashboard, summary cards provide a quick snapshot of core platform metrics. These cards allow users to instantly understand the scale and growth of their Network Copilot environment.
Each metric gives you specific visibility into how your Network Copilot environment is being used and where it’s delivering value:
- Users – Track who is actively using the platform and identify adoption across teams
- Projects – See how teams are collaborating within context-driven spaces to discuss, explore, and solve specific topics
- Conversations – Understand engagement by tracking how often users interact, ask questions, and generate insights
- LLMs – Monitor which models are being used and optimize for performance, cost, and relevance
- Agents – Measure how effectively autonomous systems are handling specific use cases and scaling automation
- Devices – Gain visibility into onboarded systems, monitor incoming data pipelines, and enable auditing and Q&A on device data
Also metric also includes trend indicators showing increases or decreases over time, allowing administrators to track platform growth and activity patterns.

These insights help organizations understand how adoption evolves across teams and use cases.
How Does the Dashboard Improve Data Connector Visibility and Activity Monitoring?
Data connectors play a crucial role in enabling AI-driven workflows and knowledge retrieval. They allow Network Copilot to access information from various internal and external sources.
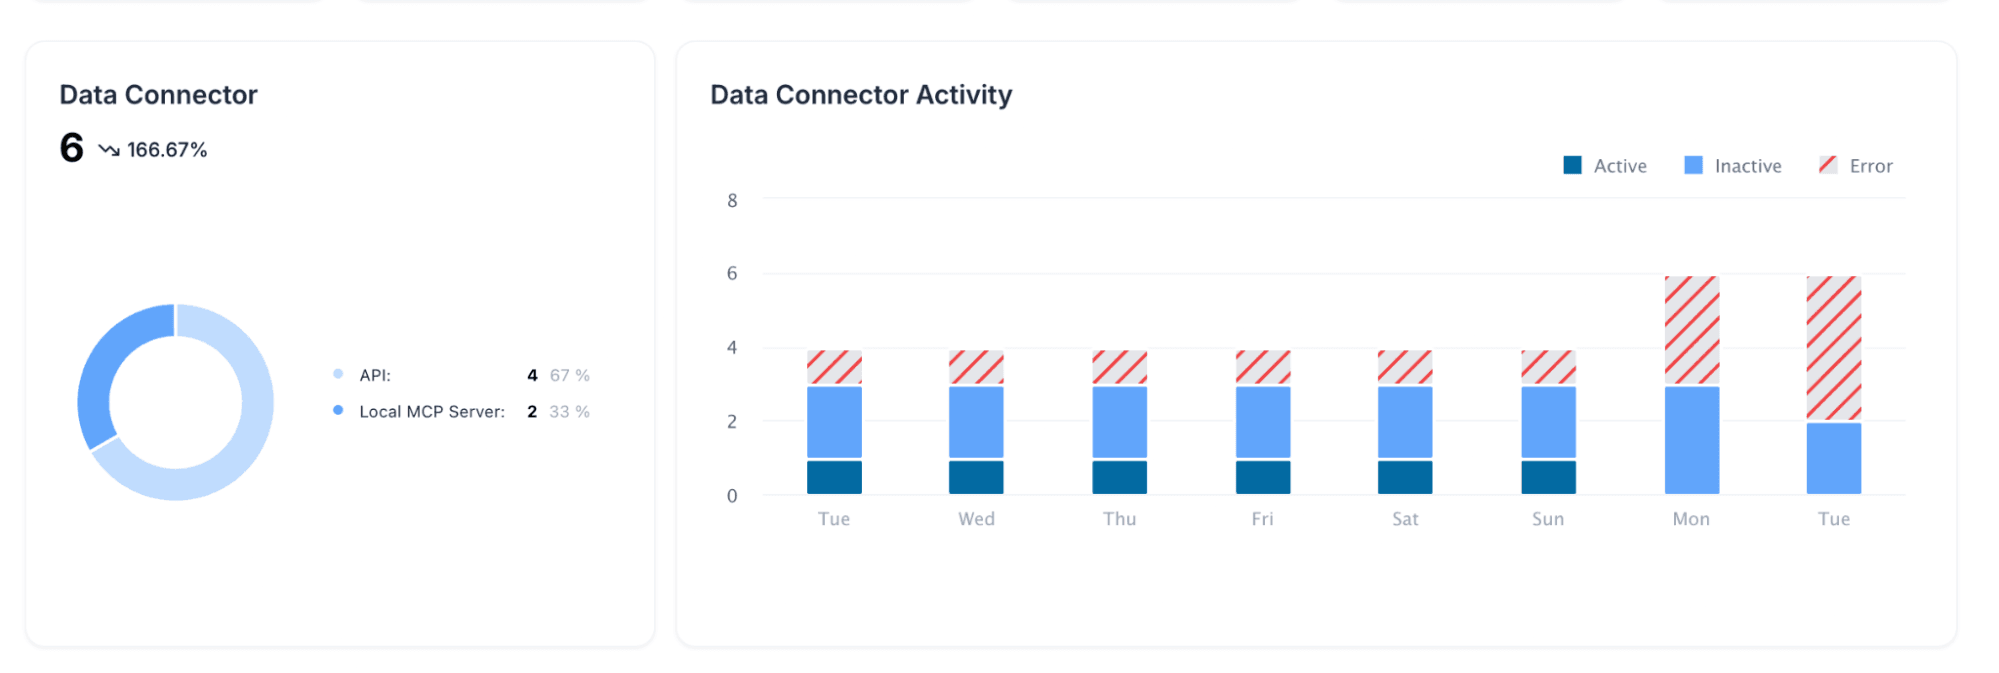
The new analytics dashboard provides clear visibility into connector usage and distribution, including:
- API-based connectors
- Local MCP server connectors
- Remote NCP connectors
This helps teams understand how their data ecosystem is structured within the platform and identify which connectors are most widely used. By monitoring connector distribution, administrators can also ensure integrations remain optimized and aligned with organizational needs.
In addition to categorization, the dashboard also provides activity insights for data connectors.
The Data Connector Activity section tracks the operational status of connectors, including:
- Active connectors
- Inactive connectors
- Error states
This visibility helps administrators detect potential issues quickly and maintain reliable integrations across the platform. Operational monitoring like this is essential for organizations relying on AI systems to access real-time or enterprise data.
How Can You Track File Operations, Queries, and Storage Usage Effectively?
The dashboard centralizes file activity, query trends, and storage insights for complete operational visibility.
Network Copilot users frequently interact with files and documents as part of their workflows. Monitoring these interactions provides valuable insights into how information flows within the platform.
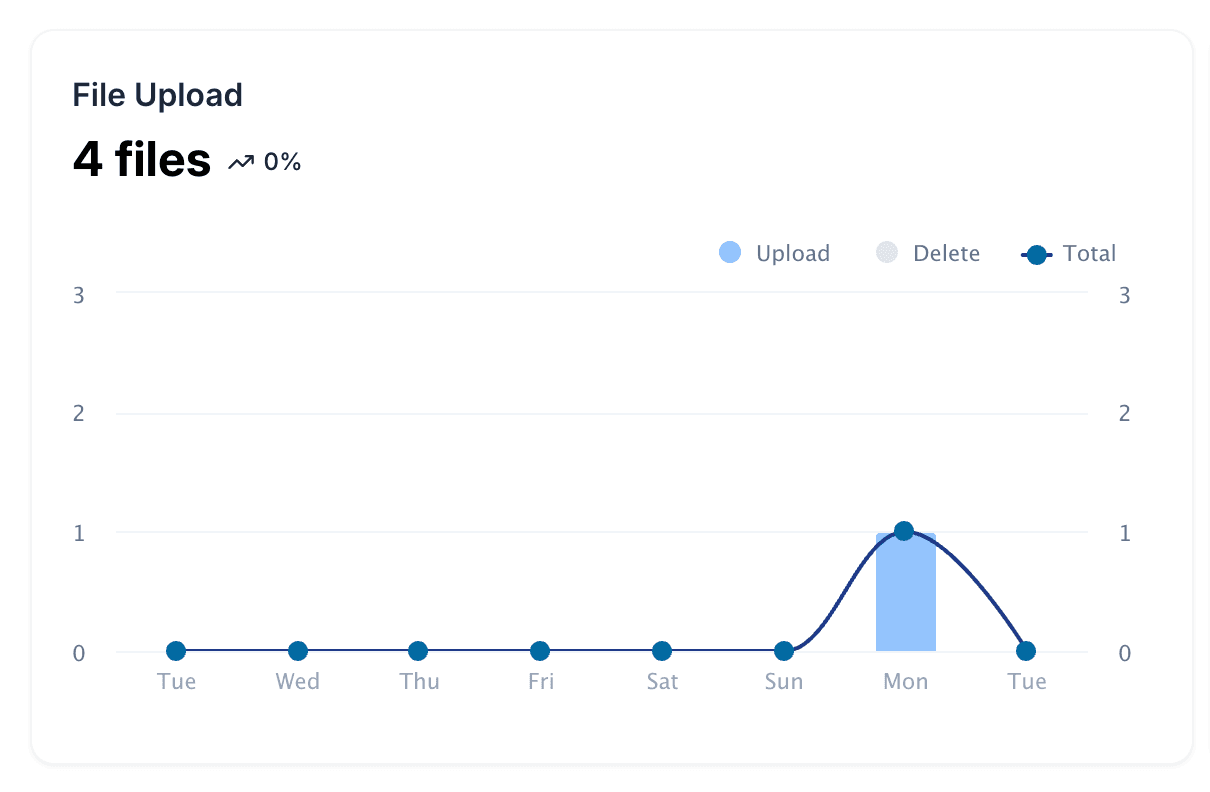
The File Operations Analytics section tracks key file-related activities such as:
- File uploads
- File deletions
- Total file operations
These metrics help administrators understand how documents are being used across projects and teams. Over time, file activity analytics can reveal patterns in content usage, document sharing, and knowledge management.
Another critical metric tracked by the dashboard is query activity across the platform.
The Query Analytics section provides insights into how frequently users interact with AI systems through individual queries.
This helps organizations:
- Understand overall AI usage
- Identify peak interaction periods
- Measure engagement with AI capabilities
- Monitor platform demand
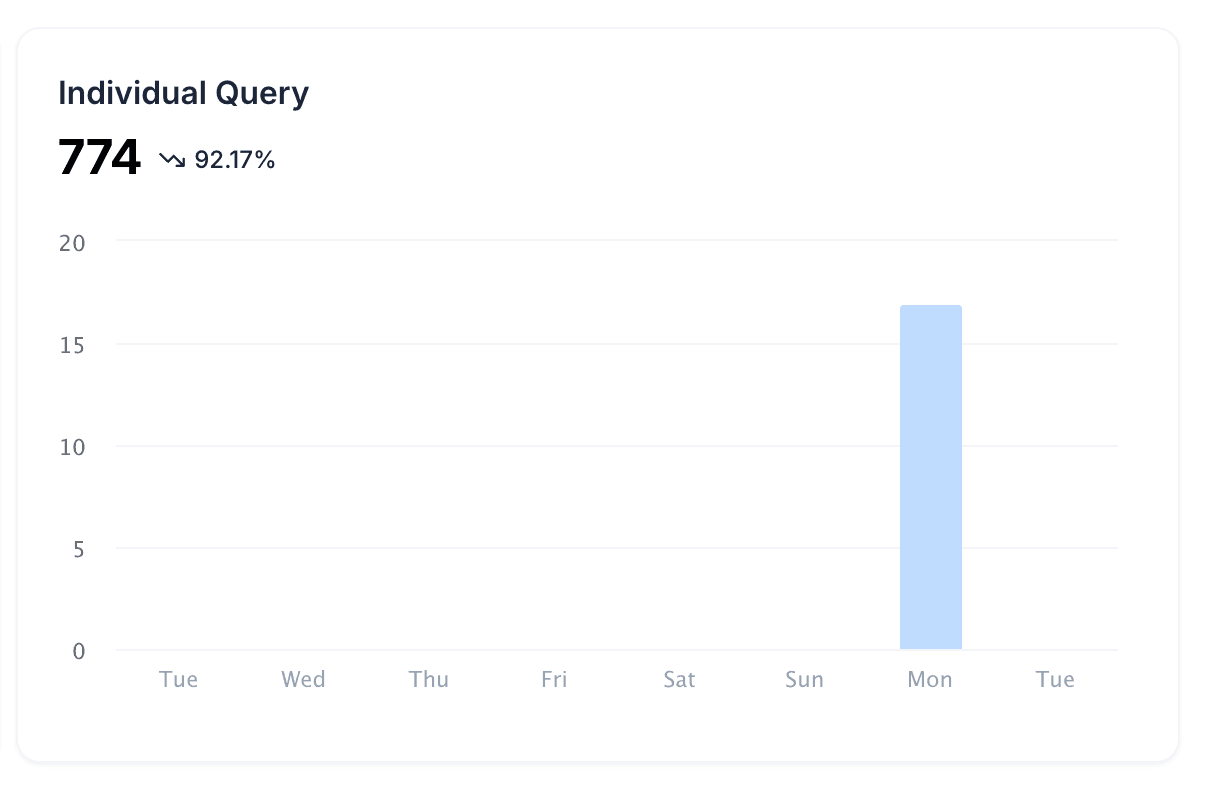
Tracking query trends allows teams to optimize system resources and better plan for scaling AI workloads.
As AI workflows grow, so does the need for efficient storage management.
The Storage Usage section of the dashboard provides a clear view of:
- Total storage capacity
- Current storage consumption
- Percentage of storage used
- Available storage space
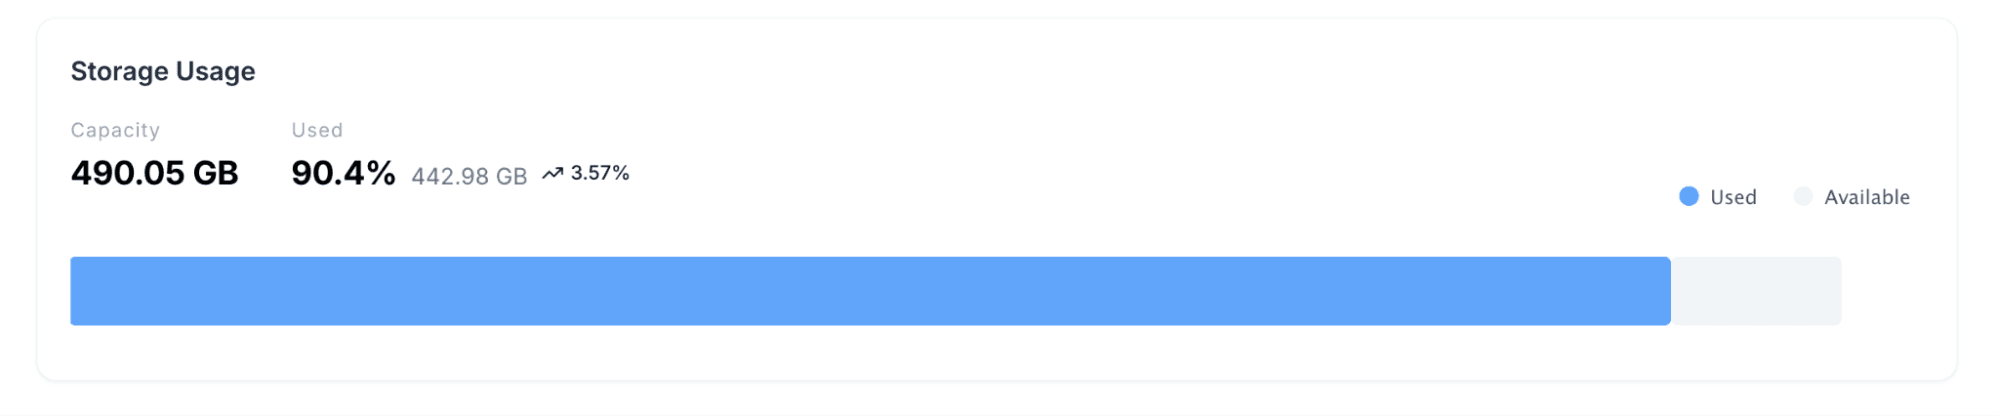
This information allows administrators to monitor storage usage proactively and plan capacity expansion when necessary. Effective storage monitoring ensures the platform remains reliable as datasets and documents continue to grow.
How Flexible Is Time-Based Analytics in the Dashboard?
It supports multiple time ranges for both real-time monitoring and long-term analysis.
Different teams require different perspectives when analyzing system usage. Some need real-time insights, while others focus on long-term trends.
The Dashboard Analytics feature supports multiple time-range views, including:
- 1 Day
- 7 Days
- 30 Days
- 90 Days
- 365 Days
This flexibility enables teams to perform both short-term monitoring and long-term usage analysis. Whether tracking daily activity spikes or evaluating yearly platform growth, the dashboard provides the insights needed.
Conclusion
Dashboard Analytics brings greater transparency and operational visibility to the Network Copilot platform. By consolidating key metrics such as users, projects, agents, conversations, data connectors, queries, file operations, and storage utilization into a single view, organizations can better understand how their AI environment is being used and how it evolves.
By unifying visibility across the platform, Dashboard Analytics empowers teams to move from reactive monitoring to proactive optimization, unlocking the full value of Network Copilot.
Frequently Asked Questions
1. What is the purpose of Dashboard Analytics in Network Copilot?
Dashboard Analytics in Network Copilot is really helpful because it brings all the Network Copilot metrics together in one place. This helps teams keep an eye on how people're using it what is going on and how well it is working. They can do all this without having to look at a lot of things.
2. Why does unified dashboard visibility matter as platform activity increases?
When a lot of things are happening on the platform it can be hard to see what is really going on. This is because there is much information everywhere. When we have all the information in one place it is easier to make decisions. We can see the picture and make decisions faster.
3. How does Dashboard Analytics help teams make data-driven decisions?
Dashboard Analytics in Network Copilot helps teams make decisions based on the information they have. They can see away how people are using the platform and what is going on. It also helps them find problems early and fix them. This means they can make decisions faster because they have all the information they need.
4. What key platform metrics are available at a glance on the dashboard?
The dashboard has something called summary cards. These cards show us information about the users, projects, conversations, LLMs, agents and devices. We can also see if things are getting better or worse over time.
5. How does the dashboard improve visibility into data connector usage and health?
The dashboard shows us how the connectors are being used. We can see which kind of connectors are being used the most. It also shows us if the connectors are working or not. This helps us keep an eye on the connectors and make sure they are working properly.
6. What insights do file operations and query analytics provide?
File operations analytics shows us what is happening with the files. We can see how many files are being uploaded, deleted and used. Query analytics shows us how often people are using the AI systems. This helps us see if people are using the platform and how much they are using it.
7. How does Dashboard Analytics support storage monitoring?
The storage usage section of the dashboard shows us how space we are using. We can see how much space is available and how much space is being used. This helps the administrators plan for the future. Make sure we have enough space.
8. How flexible are time-based analytics for monitoring and long-term analysis?
Dashboard Analytics in Network Copilot is very flexible. We can look at the information, for a time like one day or a long time like a year. This helps us see what is happening now and what has been happening over time. We can use this information to make decisions and plan for the future.
Explore Dashboard Analytics to gain complete visibility into your Network Copilot environment and start making faster, data-driven decisions today.


