





How Can Agentic AI Reduce Network Incident MTTR Across Splunk, SolarWinds, and Nexus Dashboard?
 May 30, 2026
 Network Copilot ™
TL;DR
Agentic AI can reduce network incident MTTR by automatically correlating logs, metrics, traffic data, and hardware state across Splunk, SolarWinds, and Cisco Nexus Dashboard.
The MUFG Network Incident Correlation Agent turns natural language queries into multi-platform investigations, helping L1/L2 teams identify probable root causes in under 3 minutes instead of spending 20–40 minutes on manual troubleshooting.
Introduction
In enterprise datacenter environments, network incidents are diagnosed by manually correlating information across multiple isolated observability platforms. Engineers switch between Splunk logs, SolarWinds metrics, and Cisco Nexus Dashboard states, a process that is slow, error-prone, and requires deep domain expertise.
This document presents a real-world implementation of Network Copilot (NCP) for the MUFG datacenter, where an intelligent AI agent performs autonomous cross-platform incident correlation by integrating:
- Splunk for syslog events and NetFlow/sFlow traffic analysis
- SolarWinds for real-time device health and interface metrics
- Cisco Nexus Dashboard (NDFC) for hardware operational state and transceiver data
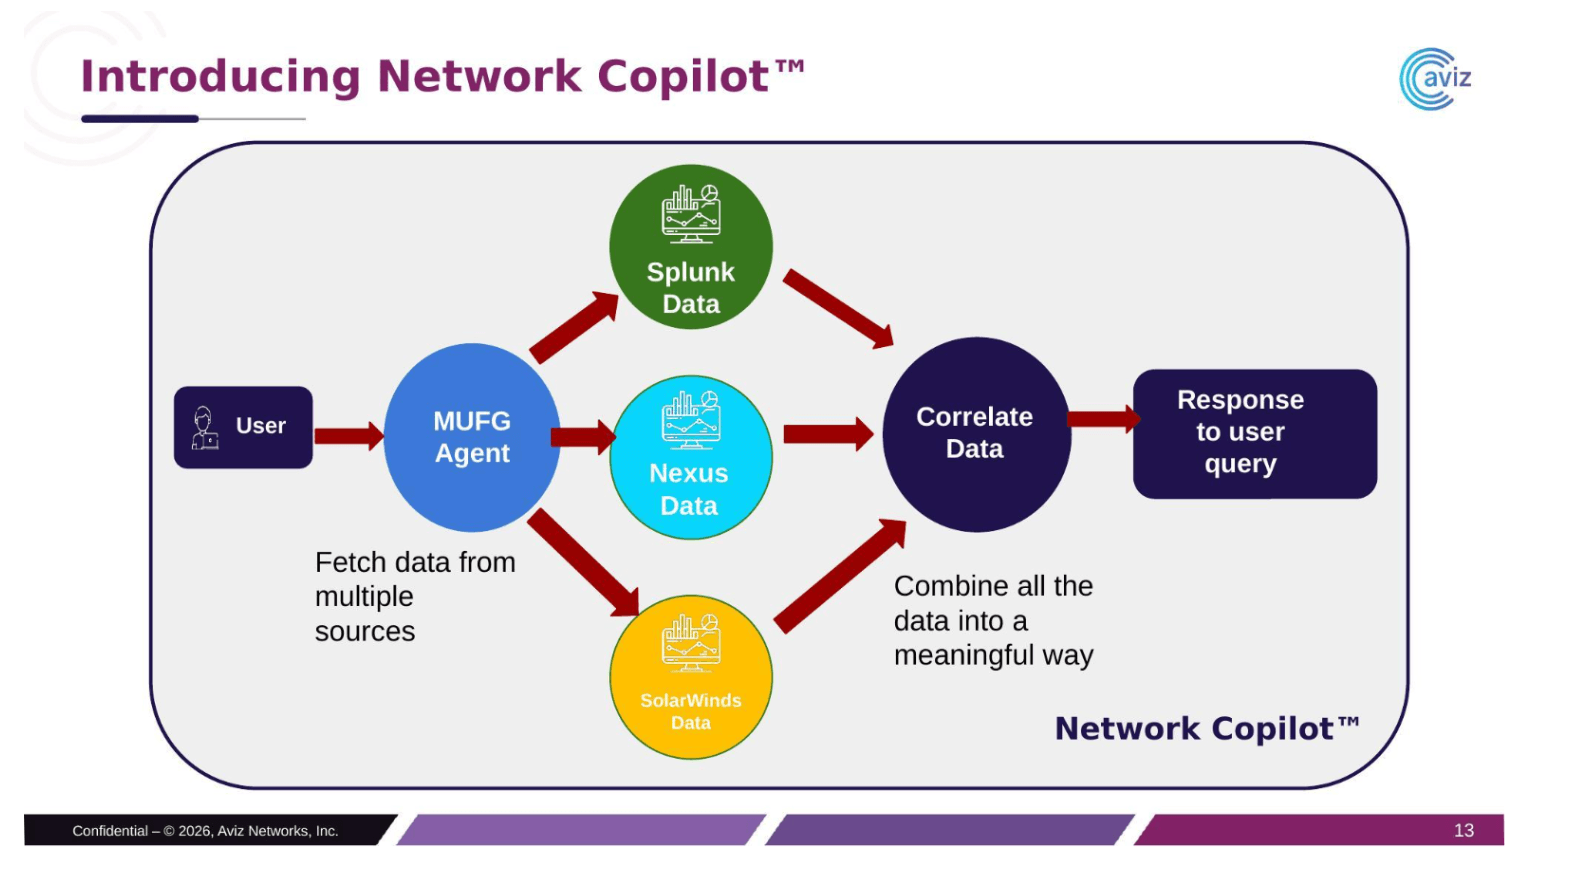
The MUFG Network Incident Correlation Agent operates as an autonomous AI Site Reliability Engineer (SRE). It collects real-time signals from all three platforms, correlates them by device, interface, IP, and time, then produces a sequenced incident explanation with a probable root cause.
Key Outcome: By eliminating manual correlation across systems, this agent reduces Mean Time To Resolution (MTTR) from 20–40 minutes to under 3 minutes, enabling L1/L2 teams to troubleshoot complex multi-layer network issues using natural language, without writing SPL queries, SWQL statements, or navigating multiple dashboards.
Why Do Enterprise Network Teams Struggle With Incident Correlation?
Modern enterprise datacenter environments generate large volumes of operational data across multiple monitoring platforms. While each system provides valuable insights independently, troubleshooting network incidents still requires significant manual effort to correlate information across domains.
Current Troubleshooting Reality
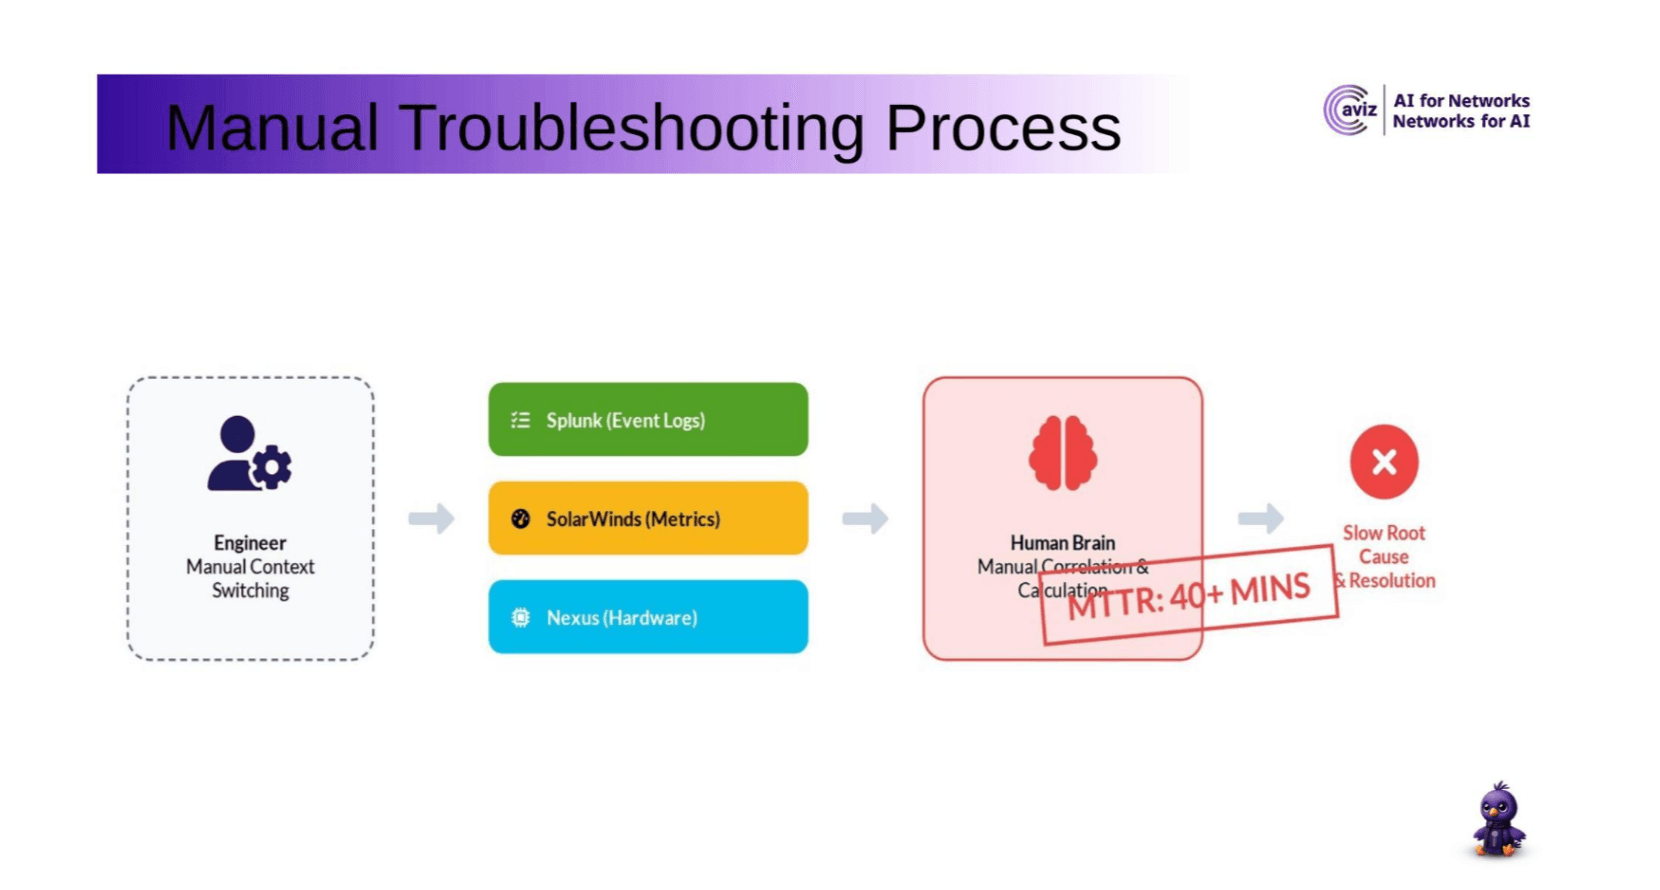
In a typical MUFG datacenter incident investigation, engineers must:
- Search syslog events in Splunk for interface state changes and errors
- Query NetFlow/sFlow records in Splunk for traffic anomalies and packet drops
- Check device CPU, memory, and interface utilization in SolarWinds
- Inspect operational hardware state in Cisco Nexus Dashboard
- Manually correlate timestamps and device identifiers across all three systems
- Derive a probable root cause from the correlated evidence
Operational Challenges
| Challenge | Description |
|---|---|
| No Unified View | Each platform operates in isolation. Splunk shows events, SolarWinds shows metrics, Nexus shows hardware state. No system correlates across all three. |
| Manual Timestamp Correlation | Engineers must mentally align events across platforms using device names, IP addresses, and timestamps. |
| Expert Dependency | L1/L2 teams frequently escalate to senior engineers because cross-layer correlation requires deep domain knowledge. |
| Slow Resolution | A single incident investigation typically takes 20–40 minutes of manual work across multiple tools. |
How Does Network Copilot Act as an Autonomous Network SRE?
Network Copilot (NCP) is an Agentic AI framework that enables platforms to not only observe telemetry but also reason across systems and execute multi-step workflows. It operates as an intelligent operational assistant that mimics the reasoning of an experienced network SRE.
Key Capabilities
- Cross-platform correlation (Splunk, SolarWinds, Nexus Dashboard)
- Autonomous multi-step data retrieval workflows
- Natural language interaction, no query syntax required
- Structured incident timelines with timestamped event sequences
- Explainable root-cause analysis backed by correlated evidence
- Formatted data tables for clear operational visibility
What Does the MUFG Network Incident Correlation Agent Integrate?
The MUFG Network Incident Correlation Agent integrates three distinct data platforms through a unified reasoning layer.
Components
| Component | Role |
|---|---|
| Splunk | Event and flow log source - syslog events, NetFlow/sFlow traffic records |
| SolarWinds Orion | Real-time infrastructure monitoring - device health, interface metrics via SNMP |
| Cisco Nexus Dashboard (NDFC) | Hardware and operational state - switch inventory, fans, PSU, transceivers |
| Network Copilot (NCP) | AI agent platform - query interpretation, data retrieval, correlation, and reasoning |
Operational Flow
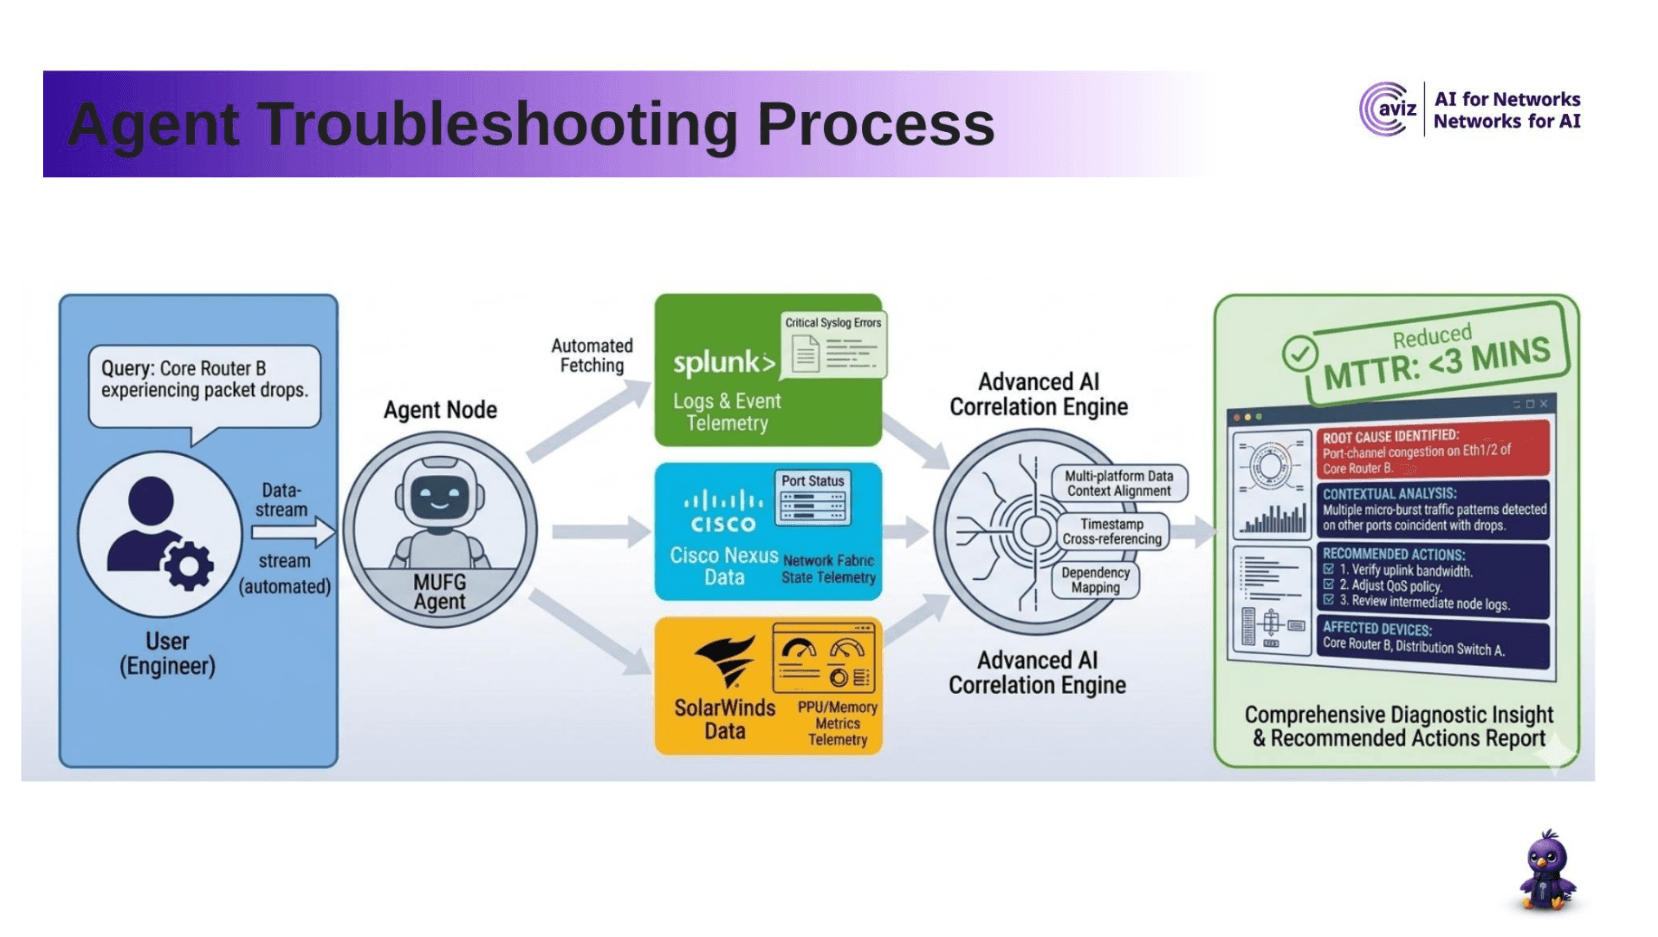
The agent operates through a clean, automated pipeline:
- User submits a natural language query (e.g., 'Core Router B is experiencing packet drops')
- The MUFG Agent node interprets the query and extracts context (device, IP, time window)
- Automated fetching retrieves data from Splunk (logs), Cisco Nexus (hardware state), and SolarWinds (metrics) simultaneously
- The Advanced AI Correlation Engine performs multi-platform data context alignment, timestamp cross-referencing, and dependency mapping
- A comprehensive diagnostic insight with recommended actions is returned to the user in under 3 minutes
What Network Signals Does the Agent Correlate?
The agent's power comes from correlating three complementary layers of network visibility. Each layer contributes a distinct type of signal that, when correlated, produces a complete incident picture.
Splunk - Event Layer (What Happened and When)
Splunk serves as the primary source of timestamped historical events. The agent queries two categories of data:
Syslog Events
- Interface up/down state changes
- Link errors and CRC failures
- Device reboots
- Port channel state changes
- STP (Spanning Tree) state changes
- Authentication events
NetFlow/sFlow Records
- Traffic volume between endpoints (bytes, packets)
- Packet drop counts
- Latency measurements
- Protocol-level flow analysis
SolarWinds - Metric Layer (How Bad Is It Now)
SolarWinds provides real-time SNMP-polled metrics representing the current state of network infrastructure:
| Metric | Purpose |
|---|---|
| CPU Load (%) | Device processing pressure |
| Memory Used (%) | Device memory utilization |
| Interface In/Out Utilization (%) | Traffic load per interface |
| Interface Errors (In/Out) | CRC errors, packet errors per hour |
| Interface Discards (In/Out) | Packet drops per hour |
| Operational Status | Interface/device up/down state |
Nexus Dashboard- Hardware Layer (Physical State)
Cisco Nexus Dashboard (NDFC) provides hardware-level operational visibility:
| Data Type | Purpose |
|---|---|
| Switch Inventory | Hostname, model, serial, firmware, fabric role |
| Interface State | Admin/operational status, speed, port type |
| Fan/PSU Modules | Hardware environmental health |
| CPU/Memory Health | Switch-level resource metrics |
| Transceiver Links | SFP optic state, physical link health |
How Does the Agent Convert Natural Language Into Root Cause Analysis?
The agent operates in three sequential stages for every investigation, ensuring systematic and comprehensive coverage of all available signals.
Stage 1 - Query Interpretation
The user submits a natural language query. The agent extracts key context elements automatically:
| Element | How Extracted | Example |
|---|---|---|
| Device hostname | Named device in query | "leaf-03", "spine-01" |
| Device IP | IP address mentioned | "10.20.11.205" |
| Source IP | "traffic FROM x" | "10.10.10.5" |
| Destination IP | "traffic TO y" | "10.10.20.7" |
| Time window | Natural language time expression | "last hour" → -1h |
| Query type | Intent classification | device health, traffic, events |
Stage 2 - Data Retrieval
Based on extracted context, the agent executes a multi-tool workflow, querying all three platforms in parallel where possible: SolarWinds device and interface metrics, Nexus Dashboard device/interface/hardware/transceiver state, Splunk syslog events (via auto-generated SPL), and Splunk flow records (via auto-generated SPL).
Stage 3 - Event Correlation
The agent performs cross-platform correlation using four linking keys:
| Correlation Key | Links |
|---|---|
| Device hostname/IP | SolarWinds node ↔ Nexus switch ↔ Splunk host field |
| Interface name | SolarWinds interface metrics ↔ Nexus interface state ↔ Splunk events |
| Timestamp | Splunk event times ↔ current metric snapshots |
| src_ip / dst_ip | Splunk flow records ↔ SolarWinds interface utilization |
What Day-to-Day Network Issues Can the Agent Solve?
The following three use cases demonstrate the agent in action, using real screenshots from the NCP interface in the MUFG environment.
Use Case 1: Why Is Application ABC Slow?
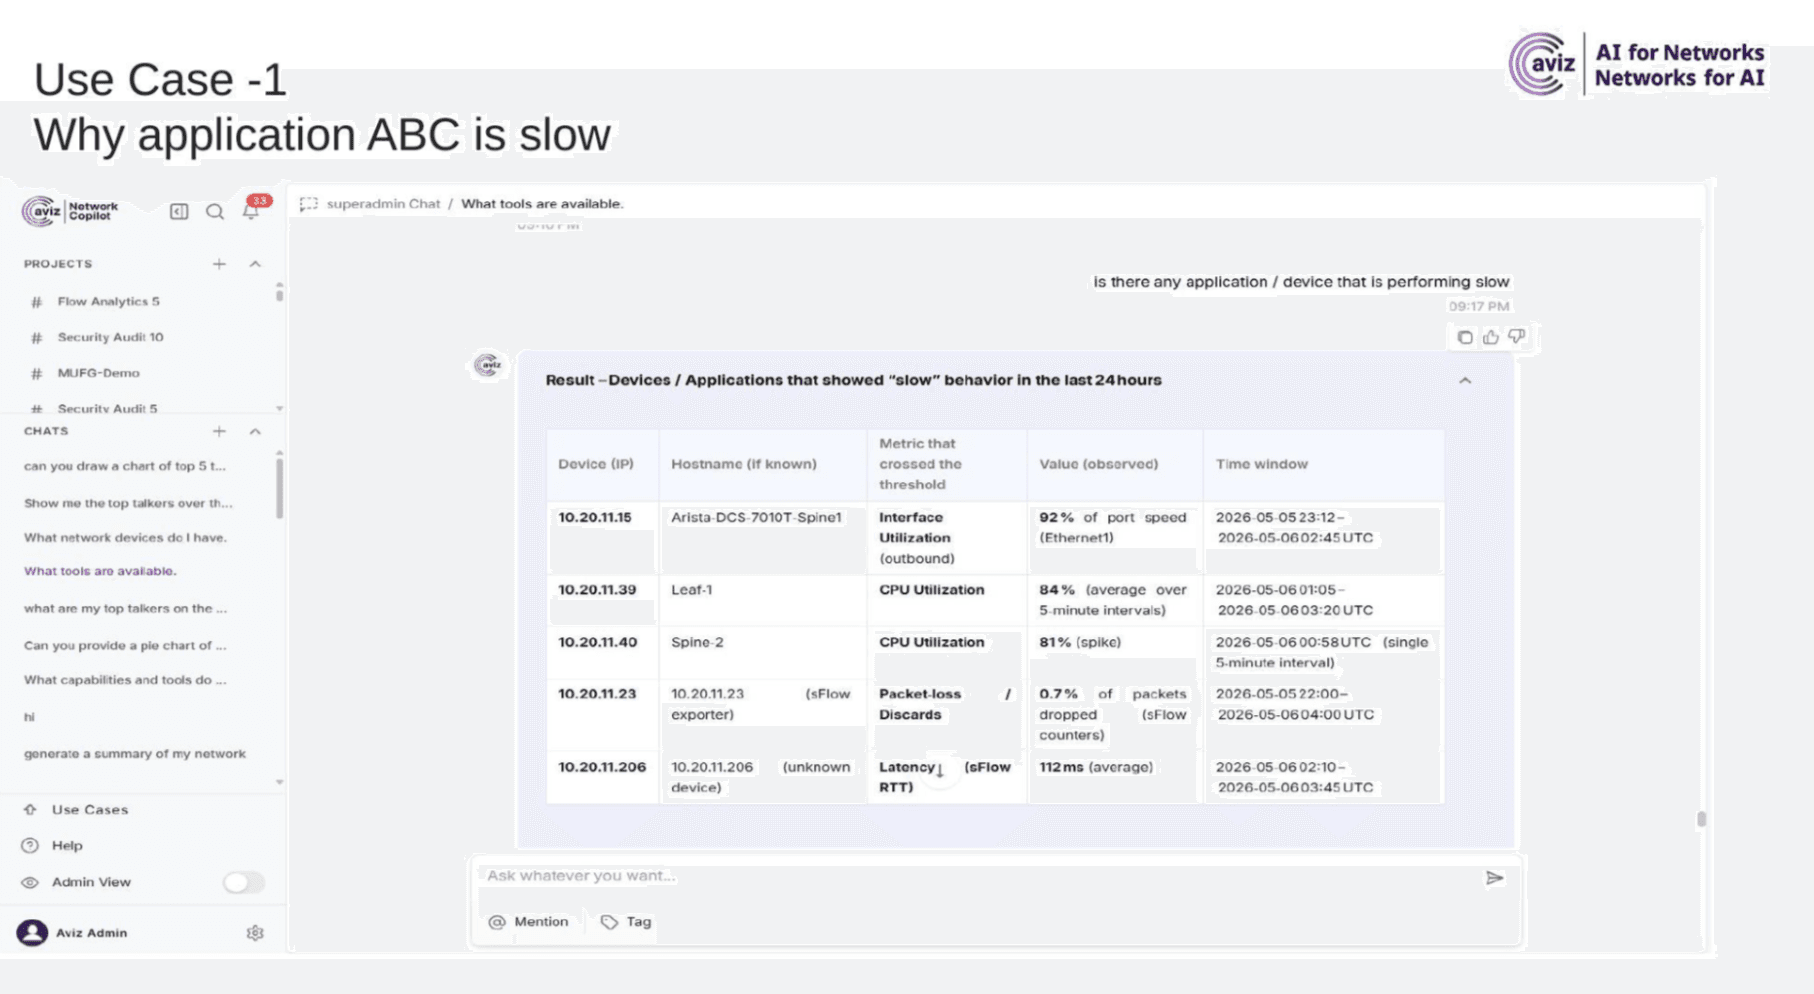
Operator Query: "Is there any application / device that is performing slow"
What the Agent Does
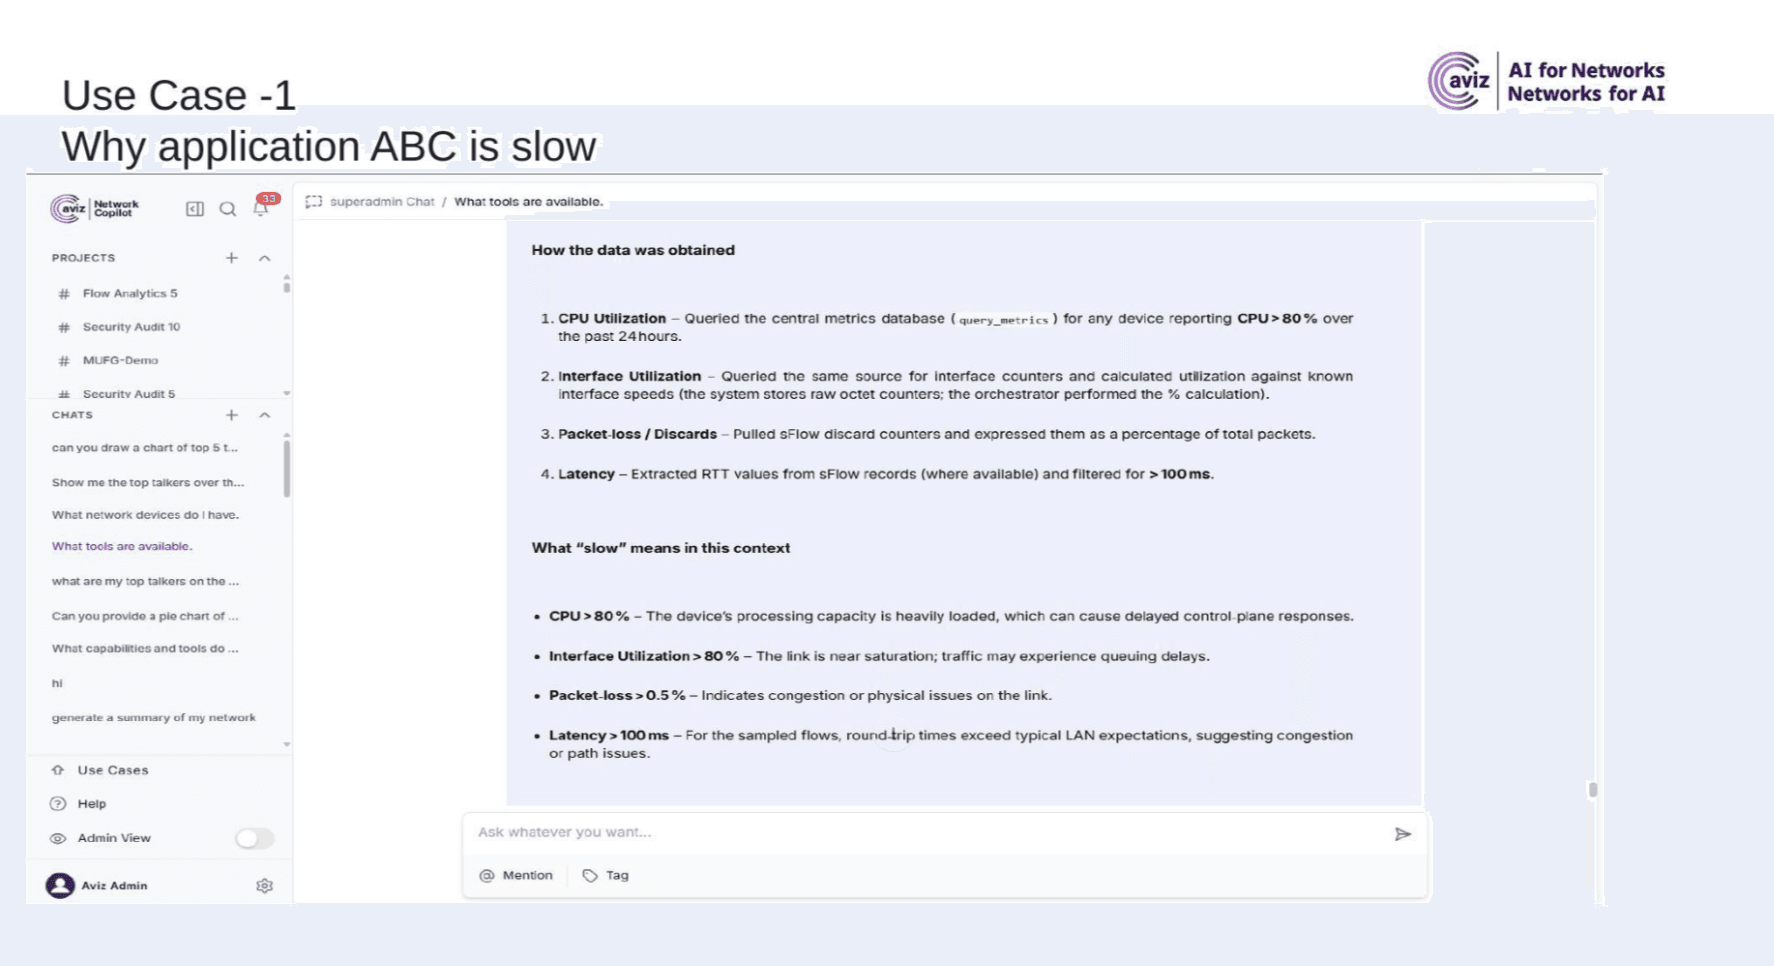
- Interprets query → identifies intent as performance anomaly scan across all devices
- Queries SolarWinds for devices with CPU >80%, interface utilization >80%
- Pulls sFlow discard counters for packet-loss/discard percentage
- Extracts RTT values from sFlow records filtered for >100ms latency
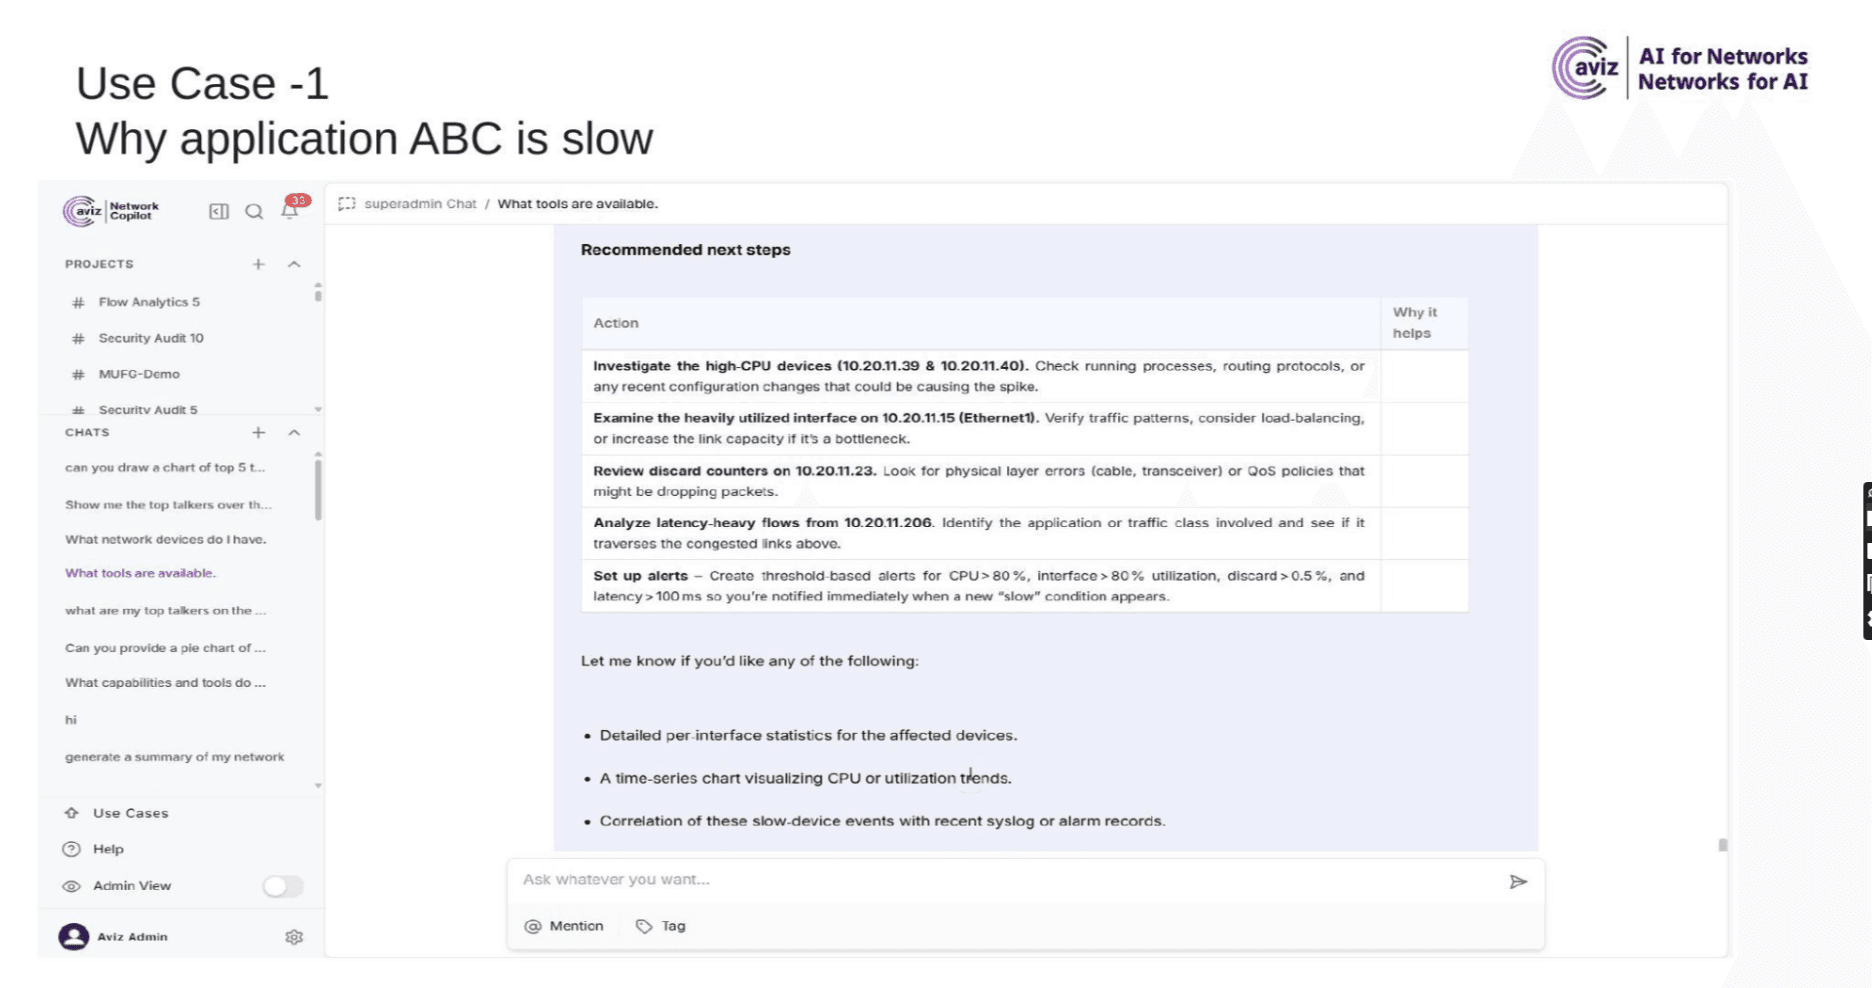
- Correlates and returns a ranked table of slow devices/applications
Key Findings from This Use Case
- Arista-DCS-7010T-Spine1 (10.20.11.15): Interface Ethernet1 at 92% outbound utilization - near saturation
- Leaf-1 (10.20.11.39): CPU at 84% (average over 5-minute intervals) - heavy processing load
- Spine-2 (10.20.11.40): CPU spike at 81% - single 5-minute interval spike
- 10.20.11.23 (sFlow exporter): 0.7% packet-loss/discards in sFlow counters
- 10.20.11.206: 112ms average latency - exceeds typical LAN expectations
Use Case 2: Is There Packet Loss Between Host A and Host B?
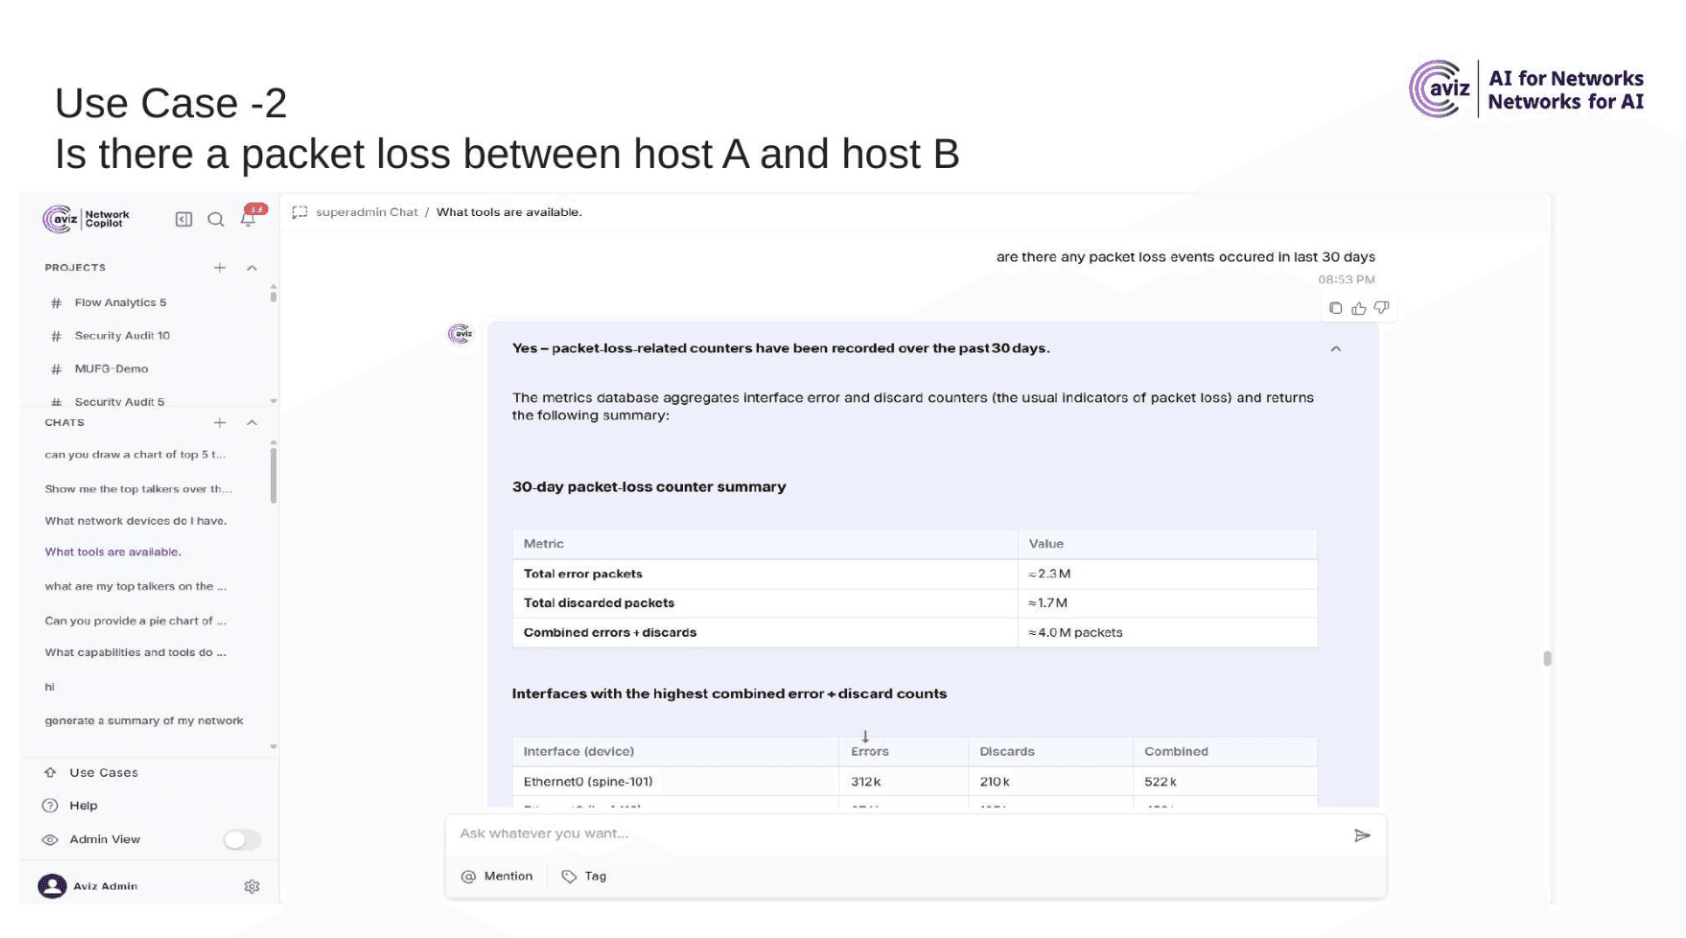
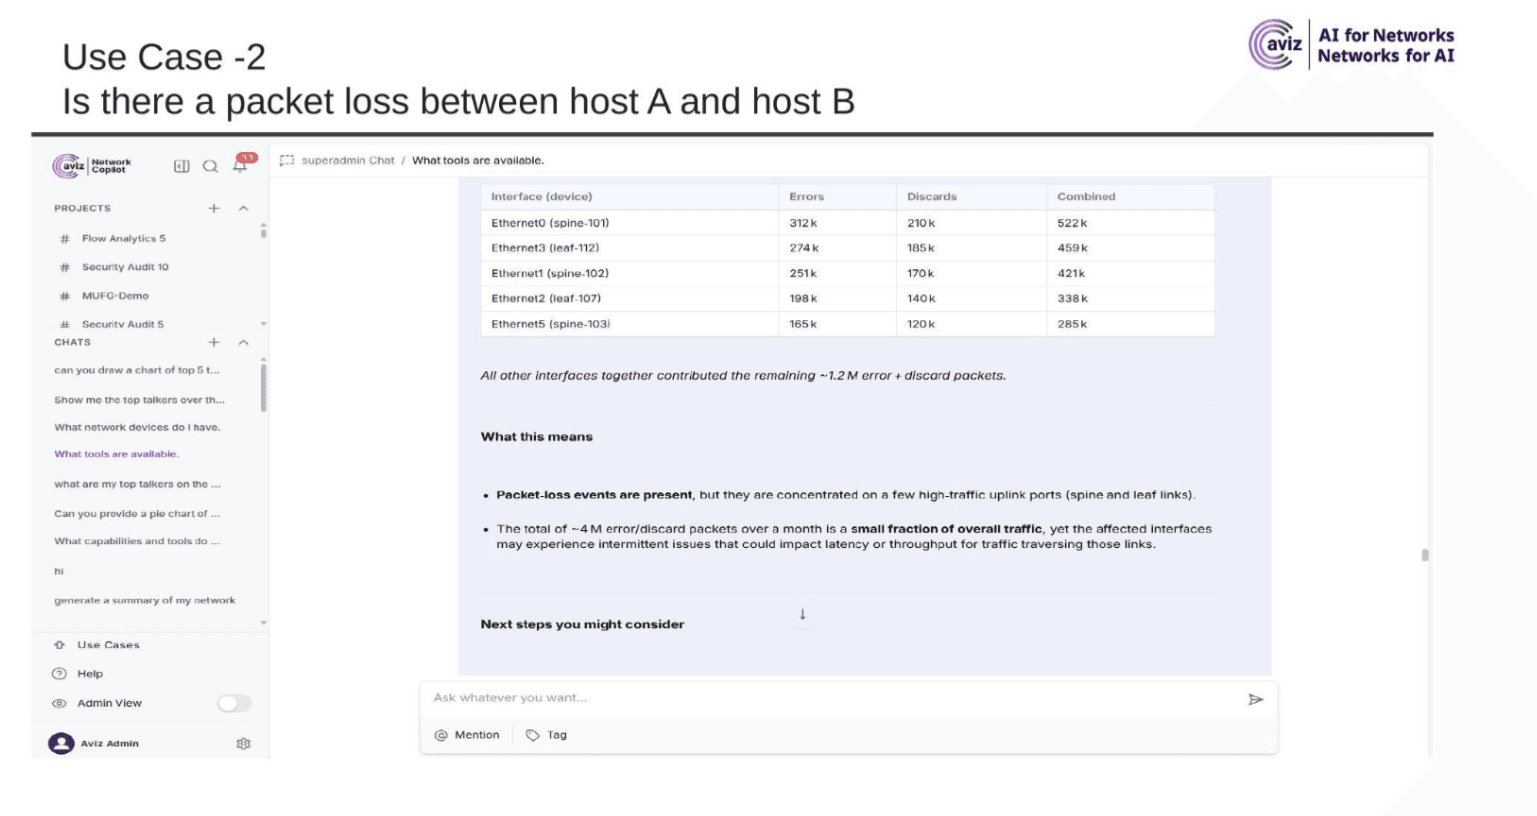
Operator Query: "Are there any packet loss events occurred in last 30 days"
What the Agent Does
- Queries the metrics database for interface error and discard counters over 30 days
- Aggregates total error packets, discarded packets, and combined counts
- Identifies the interfaces with the highest combined error + discard counts
- Pinpoints which spines and leaves are most affected
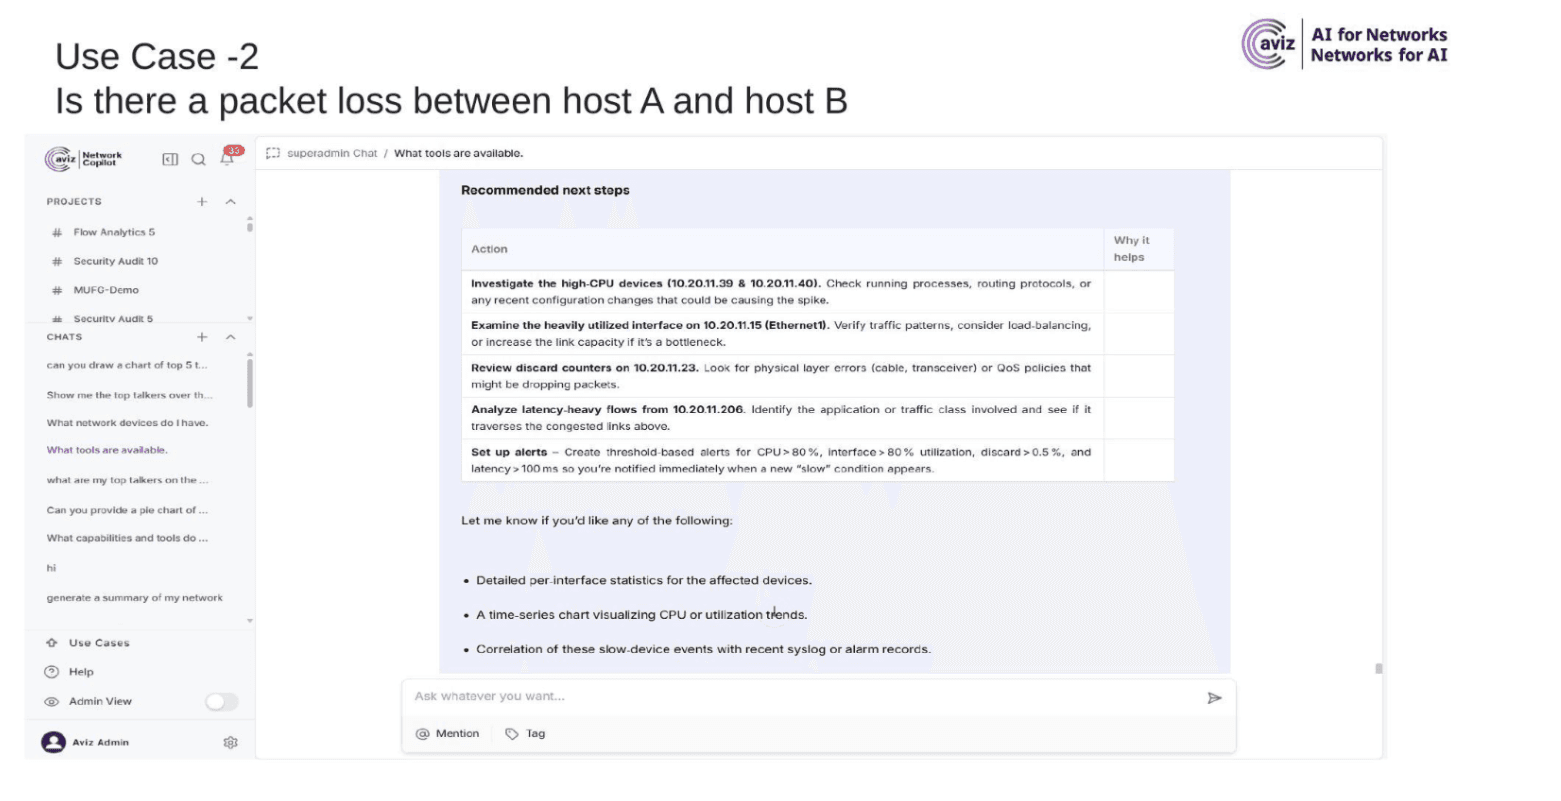
- Correlates with interface utilization to establish cause-effect relationship
Key Findings from This Use Case
- Packet-loss events are present but concentrated on a few high-traffic uplink ports
- ~4M combined error/discard packets over 30 days - a small fraction of overall traffic but significant for affected paths
- Ethernet0 (spine-101) and Ethernet3 (leaf-112) are the most impacted interfaces
- Drop rate concentration suggests intermittent issues rather than complete failure
Use Case 3: Complete Device Investigation from Multiple Sources
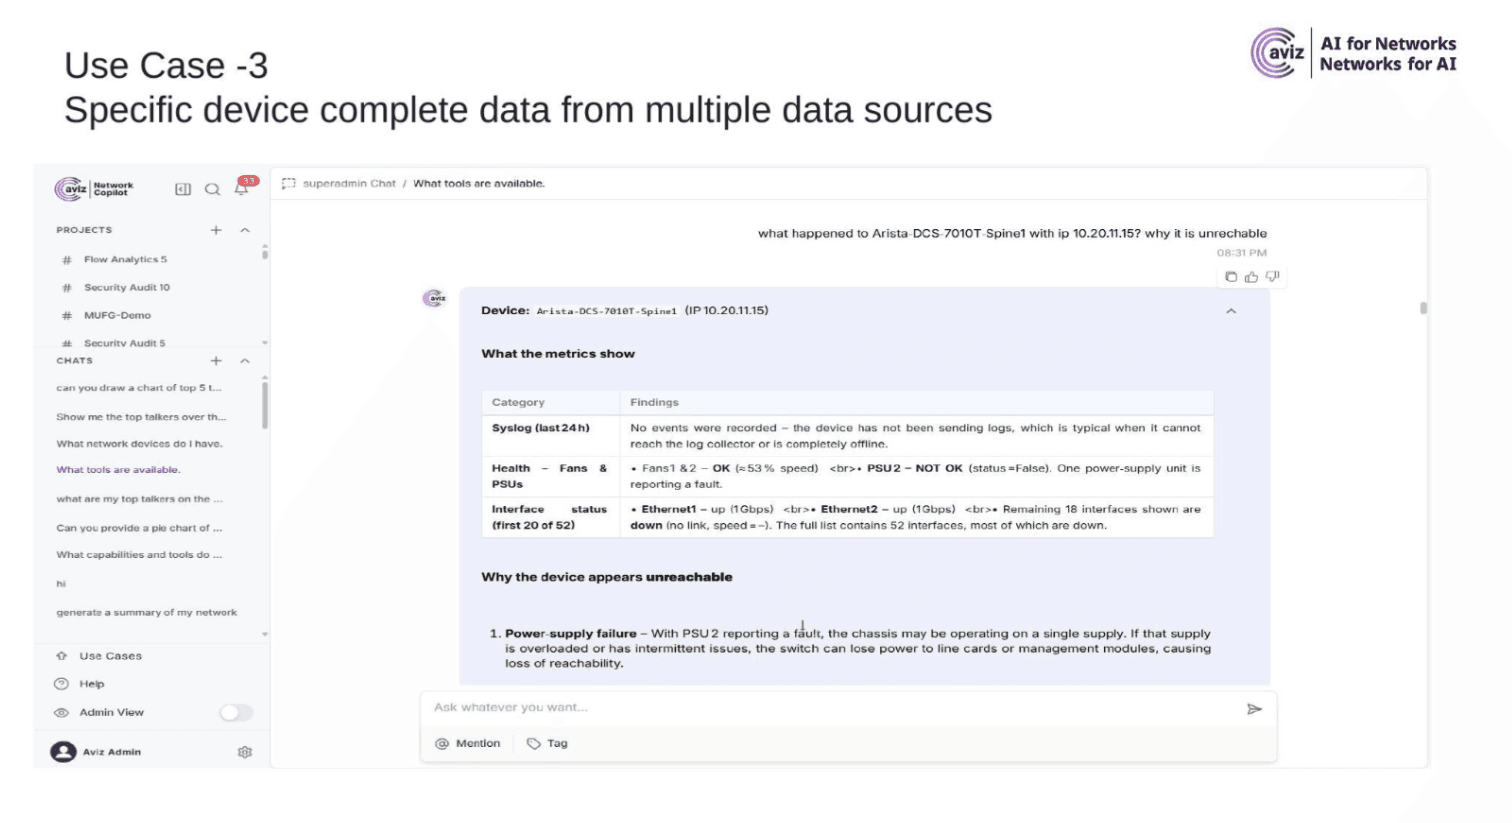
Operator Query: "What happened to Arista-DCS-7010T-Spine1 with IP 10.20.11.15? Why is it unreachable?"
What the Agent Does
This triggers the most comprehensive workflow - querying all data types from all three platforms:
- SolarWinds → Device health metrics (CPU, memory, status)
- SolarWinds → All interface metrics (utilization, errors, discards)
- Nexus Dashboard → Device inventory (model, firmware, operational state)
- Nexus Dashboard → Interface states (first 20 of 52 interfaces)
- Nexus Dashboard → Fan and PSU module status
- Splunk → Syslog events for the last 24 hours (result: no events - device offline)
Key Findings from This Use Case
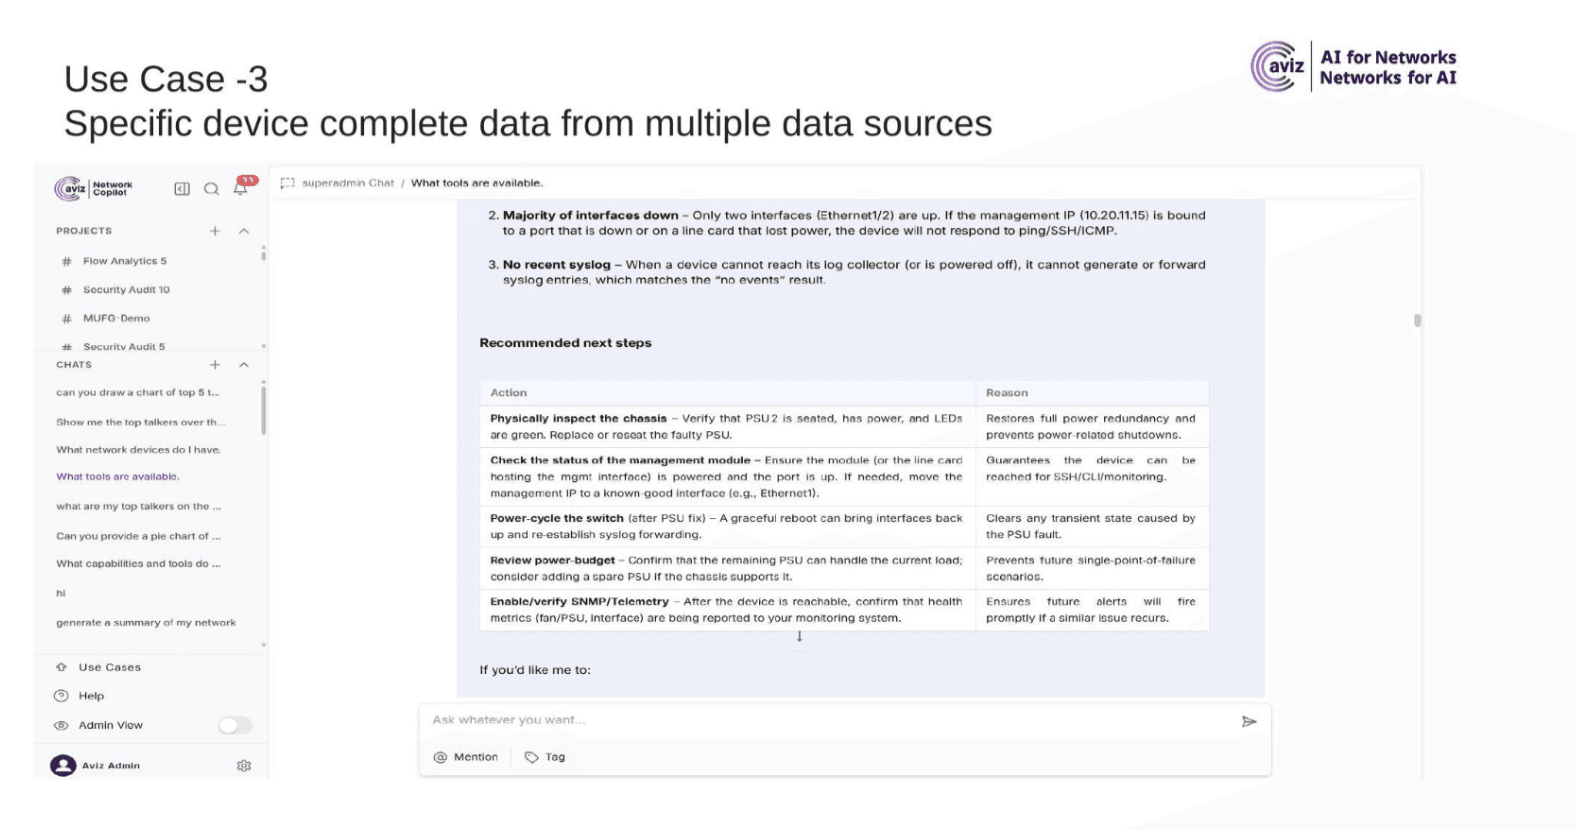
- PSU2 reporting a fault - chassis running on single power supply
- 52 interfaces visible; only Ethernet1 and Ethernet2 are up (1Gbps each); remaining 50 are down
- No syslog events recorded - device cannot reach the log collector, consistent with offline state
- Fan modules healthy - environmental issue is isolated to the PSU
- Root cause: Power supply failure causing loss of reachability
How Much Faster Is Agentic AI Compared to Manual Troubleshooting?
BEFORE - Manual Troubleshooting
| Step | Action | Platform | Time |
|---|---|---|---|
| 1 | Log into Splunk, write SPL query for syslog events | Splunk | 3 min |
| 2 | Search NetFlow logs for packet drops between endpoints | Splunk | 4 min |
| 3 | Log into SolarWinds, navigate to device, check interface utilization | SolarWinds | 5 min |
| 4 | Identify which device is generating errors | Manual | 3 min |
| 5 | Log into Nexus Dashboard, check hardware state | Nexus | 4 min |
| 6 | Manually correlate timestamps across all platforms | Manual | 6 min |
| Total Time | ~25 min | ||
AFTER - Using MUFG Network Incident Correlation Agent
User query: "Traffic between 10.10.10.5 and 10.10.20.7 is slow"
The agent automatically: queries all three platforms simultaneously, correlates events by device, interface, and timestamp, produces structured incident timeline, and identifies the probable root cause.
| Metric | Before (Manual) | After (MUFG Agent) |
|---|---|---|
| Resolution Time | 20–40 minutes | < 3 minutes |
| Platforms Queried | 3 (manually) | 3 (automated) |
| Query Syntax Required | SPL, SWQL, Nexus UI | Natural language |
| Correlation | Manual | Automated |
| L1/L2 Escalation | Frequent | Rare |
| MTTR Improvement | Baseline | 85–93% faster |
What Questions Can the MUFG Agent Answer for NetOps Teams?
The MUFG Network Incident Correlation Agent is designed to answer these operational questions through automated cross-platform data retrieval and correlation:
- Why is application ABC slow? → Correlates flow drops, interface errors, and device events on the traffic path.
- Is there packet loss between host A and host B? → Queries NetFlow records for drop counts between the IP pair.
- Did any network device report errors during the incident window? → Searches SolarWinds interface error counters and Splunk syslog events.
- Did any interface go down during the incident? → Checks Splunk syslog for interface state change events.
- Which device is associated with the traffic path between two endpoints? → Identifies devices from SolarWinds and Nexus by IP address mapping.
- Did interface utilization spike during the event? → Retrieves SolarWinds interface utilization percentages.
- Are there packet drops in NetFlow/sFlow logs? → Builds and executes SPL query for flow drop statistics.
- Did SolarWinds detect abnormal device metrics? → Checks CPU load, memory pressure, and interface counters.
- Which device event occurred immediately before the performance degradation? → Orders Splunk syslog events chronologically and correlates with flow anomalies.
- What is the most likely network component causing the issue? → Correlates evidence from 2+ platforms to identify the probable root cause.
How Is the MUFG Network Copilot Agent Implemented?
Agent Tools
The agent uses four purpose-built tools plus one MCP connector:
| Tool | Platform | Purpose |
|---|---|---|
| get_solarwinds_data | SolarWinds Orion | Device health, interface metrics via SWQL REST API |
| get_nexus_data | Cisco NDFC | Switch inventory, interfaces, fans/PSU, CPU/memory, transceivers |
| build_syslog_search_query | Splunk (Step 1) | Constructs SPL query for syslog events |
| build_flow_search_query | Splunk (Step 1) | Constructs SPL query for NetFlow/sFlow records |
| search_splunk (MCP) | Splunk (Step 2) | Executes SPL queries and returns results |
Splunk Two-Step Pattern
Splunk integration uses a deliberate two-step process:
- Build - A query builder tool constructs an optimized SPL string based on the investigation parameters
- Execute - The generated SPL is passed to the search_splunk MCP connector for execution
This separation ensures query construction is deterministic and auditable while execution leverages the Splunk API directly.
Data Retrieval Workflows
| Query Type | Platforms Queried | Tools Invoked |
|---|---|---|
| Device Listing | SolarWinds + Nexus | 2 tools |
| Device Health | SolarWinds + Nexus + Splunk | 7+ tools |
| Traffic Flow | Splunk + SolarWinds + Nexus | 6+ tools |
| Event Search | Splunk + SolarWinds + Nexus | 5+ tools |
Platform & LLM
- Platform: Network Copilot (NCP) Agentic AI Framework
- LLM: Gemini via NCP
- LLM Responsibilities: Interpret user queries, select relevant data sources, correlate event sequences, generate structured incident summaries
- Data retrieval: Handled entirely by NCP tool connectors (not the LLM directly)
Conclusion
The MUFG Network Incident Correlation Agent demonstrates how Network Copilot transforms traditional multi-platform troubleshooting into an intelligent, automated workflow. By correlating real-time metrics from SolarWinds, hardware state from Nexus Dashboard, and timestamped events from Splunk, the agent eliminates the need for manual cross-system analysis.
For enterprise datacenter operations, this approach delivers:
- Faster incident resolution - From 20–40 minutes to under 3 minutes. No manual platform navigation or query writing required.
- Reduced operational overhead - Engineers interact using plain English instead of SPL, SWQL, or CLI commands.
- Improved accuracy - Automated correlation eliminates human error in timestamp matching and cross-platform analysis.
- L1/L2 self-sufficiency - Natural language interface requires no specialized query syntax knowledge - junior engineers can resolve what previously needed senior escalation.
- Explainable outcomes - Every conclusion is backed by correlated evidence from multiple platforms, making root cause findings auditable and trustworthy.
Looking Ahead: As network environments continue to grow in complexity - more devices, more interfaces, and more monitoring platforms - agentic AI systems like the MUFG Network Incident Correlation Agent represent a fundamental shift toward proactive, explainable, and intelligent network operations. This approach augments engineering teams and redefines modern NetOps.
Frequently Asked Questions
What problem does the MUFG Network Incident Correlation Agent actually solve?
Engineers were logging into Splunk, SolarWinds, and Cisco Nexus Dashboard separately, manually correlating timestamps and device identifiers across all three, and spending 20 to 40 minutes per incident. One agent now queries all three platforms simultaneously, correlates the signals automatically, and returns a probable root cause with recommended actions in under 3 minutes. Manual tool-hopping is gone.
How does the agent turn a plain English question into a cross-platform investigation?
Three stages run sequentially. First the agent extracts context from the query including device name, IP address, time window, and intent. Then it fetches data from SolarWinds, Nexus Dashboard, and Splunk in parallel using purpose-built tool connectors. Finally the correlation engine aligns events by device hostname, interface name, timestamp, and IP address across all three platforms and produces a structured incident timeline with a root cause.
How much faster is the agent compared to manual troubleshooting?
Manual troubleshooting across the three platforms takes 20 to 40 minutes. The agent does the same investigation in under 3 minutes. That is an 85 to 93 percent reduction in MTTR. L1 and L2 teams that previously escalated to senior engineers because cross-layer correlation required deep expertise can now resolve those incidents themselves using plain language queries.
What did the agent find in the real-world power supply failure case at MUFG?
The query was about an Arista spine switch that became unreachable. The agent pulled hardware state from Nexus Dashboard, metrics from SolarWinds, and syslog from Splunk. It found PSU2 reporting a fault, 50 of 52 interfaces down, and no syslog events because the device could not reach the log collector. Root cause: power supply failure. The agent recommended physically inspecting PSU2, checking the management module, and power-cycling after the fix.
What data does each platform contribute to the agent's investigation?
Splunk provides timestamped syslog events covering interface state changes, CRC errors, reboots, and port channel changes, plus NetFlow and sFlow records for traffic volume, packet drops, and latency. SolarWinds provides real-time SNMP-polled metrics including CPU load, memory usage, interface utilisation, errors, and discards. Cisco Nexus Dashboard provides hardware-level state including switch inventory, interface status, fan and PSU health, and transceiver data.
Why does manual timestamp correlation across multiple platforms slow down incident resolution so much?
Each platform uses its own time format, device naming convention, and interface naming. Matching a Splunk syslog entry to a SolarWinds metric to a Nexus interface state by hand requires the engineer to mentally hold all three contexts at once. One mismatch sends the investigation down the wrong path. At 20 to 40 minutes per incident and multiple incidents a day, that manual correlation cost adds up to hours of engineering time that could be spent on something more valuable.
How does the two-step Splunk integration keep query construction auditable?
The agent splits Splunk queries into two distinct steps. A query builder tool constructs the SPL string based on investigation parameters first. A separate MCP connector then executes that query against the Splunk API. Keeping build and execute separate means the constructed query is visible and auditable before anything runs. Engineers can see exactly what SPL was generated rather than trusting a black box that wrote and ran a query invisibly.
Why does explainability matter as much as speed in agentic network troubleshooting?
A fast answer that nobody can verify is hard to act on in a production environment. Every conclusion the MUFG agent produces is backed by correlated evidence from at least two platforms so engineers can see exactly what data led to the root cause finding. That auditability is what makes the output trustworthy rather than just fast. When the agent says PSU2 caused the outage, there is evidence from three platforms supporting that conclusion, not just an AI guess.
Ready to reduce network incident MTTR with autonomous, cross-platform correlation? Explore how Aviz Network Copilot helps enterprise NetOps teams troubleshoot faster, eliminate manual tool-hopping, and identify root causes across Splunk, SolarWinds, and Cisco Nexus Dashboard using natural language.


