





From Data to Decisions: How Nexus Dashboard Integration Supercharges Network Copilot
 October 6, 2025
 Network Copilot ™

Summary
Integrating Cisco Nexus Dashboard with Network Copilot gives your team a live, queryable view of your network. Inventory, health, and performance data flow directly into one AI-powered workspace, helping you monitor, analyze, and act faster than ever.
Introduction
In large enterprise and data center networks, it's one thing to know what's happening. It's another thing to know it right now and take immediate action.
That's where the Nexus Dashboard Integration for Network Copilot comes in. By connecting Cisco's Nexus Dashboard with Copilot's AI analytics, your team gets a real-time, searchable, and tag-filtered view of your entire network. This means faster troubleshooting, smarter capacity planning, and more efficient operations.
In this article, we'll walk through exactly how the integration works, what it enables, and why it's a game-changer for network operations.
Why Integrating Nexus Dashboard with Copilot Is a Game-Changer
It connects Cisco Nexus Dashboard with Network Copilot, giving NetOps teams live, actionable network data. Inventory, health metrics, and performance counters become searchable and tag-filtered, making it easier to act on insights immediately.
Traditionally, Nexus Dashboard's inventory and health data lived in its own interface. It was valuable, but siloed. With this integration:
- Inventory and health insights stream directly into Copilot's AI workspace.
- Tags let you scope queries to a single fabric, location, or technology.
- Unified prompts give you answers instantly, without switching tools.
- Multiple use cases, from proactive monitoring to capacity planning, are now at your fingertips.
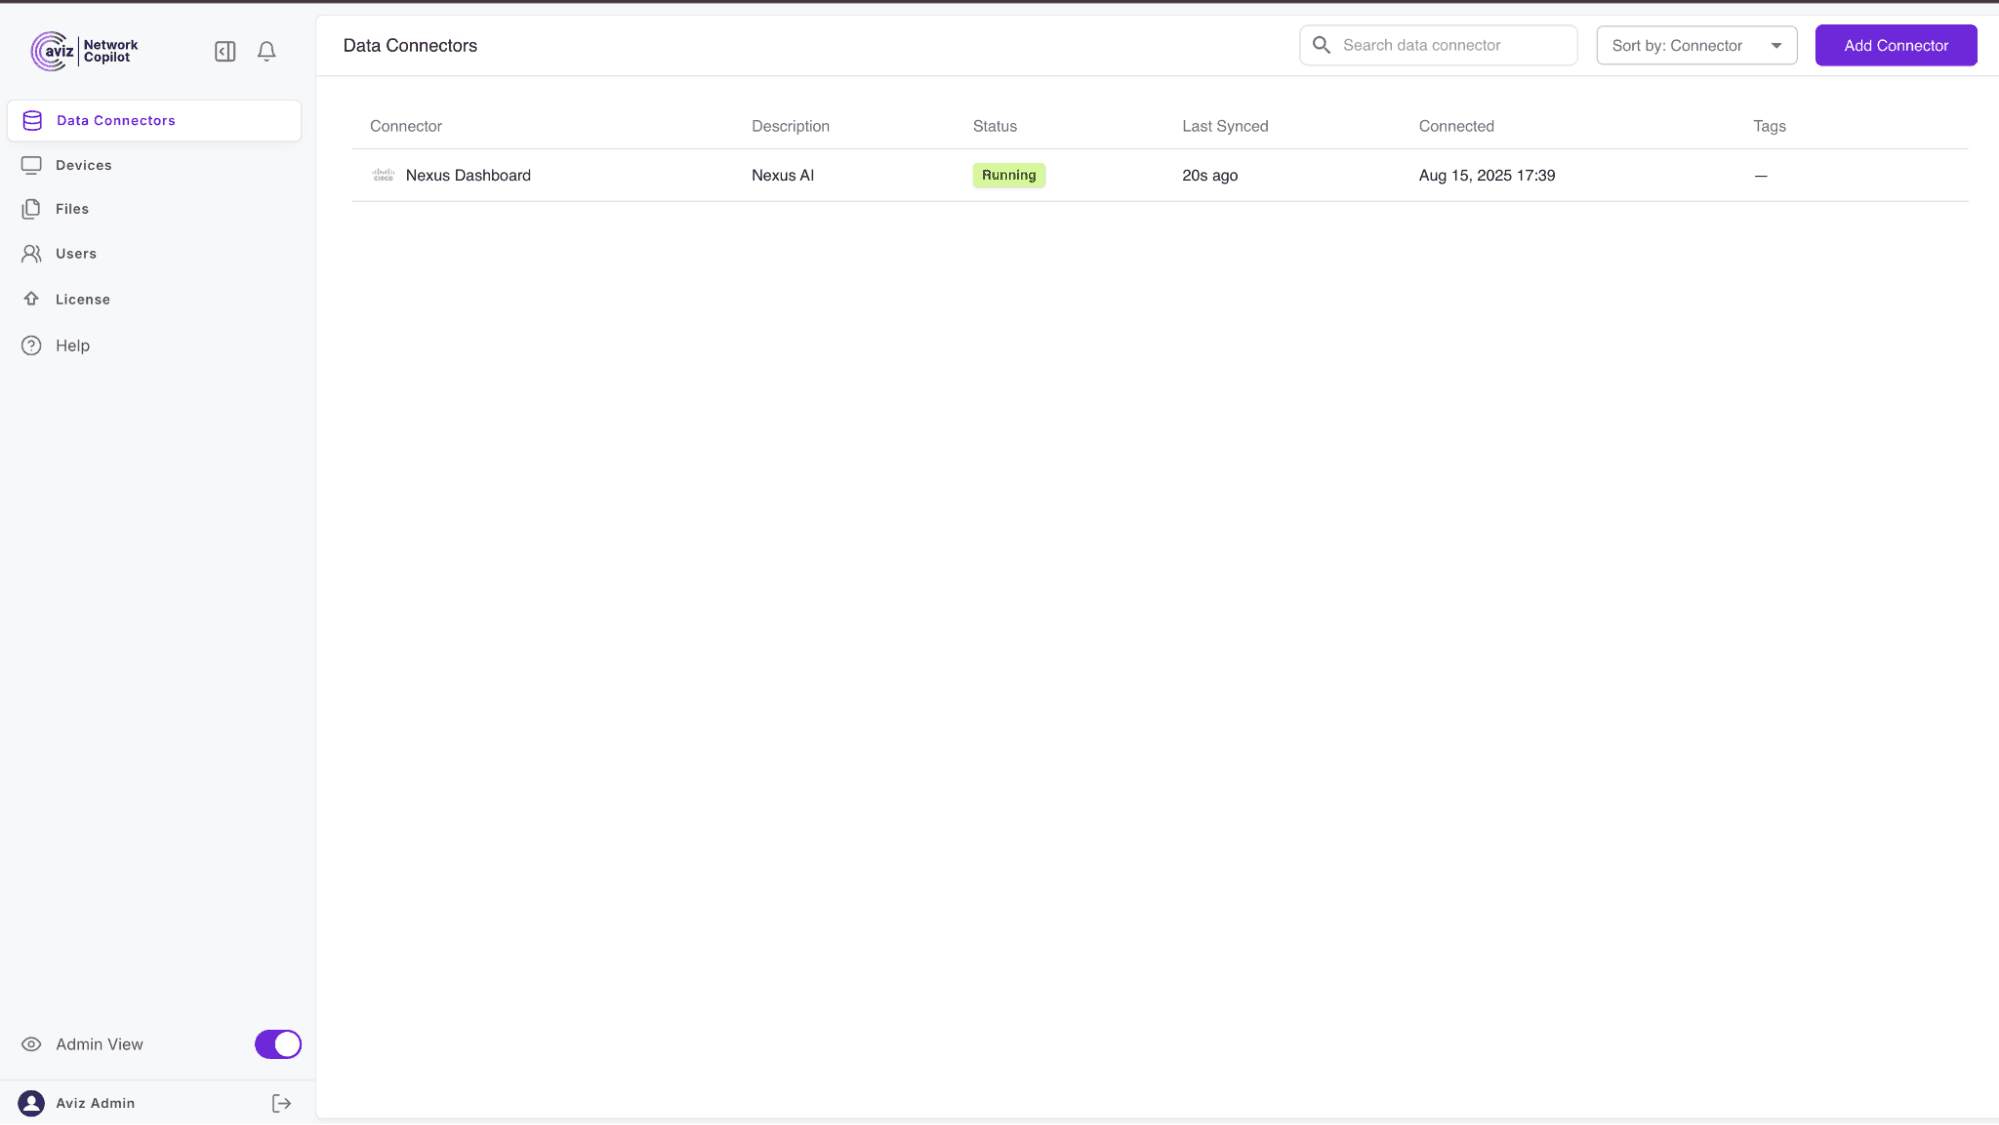
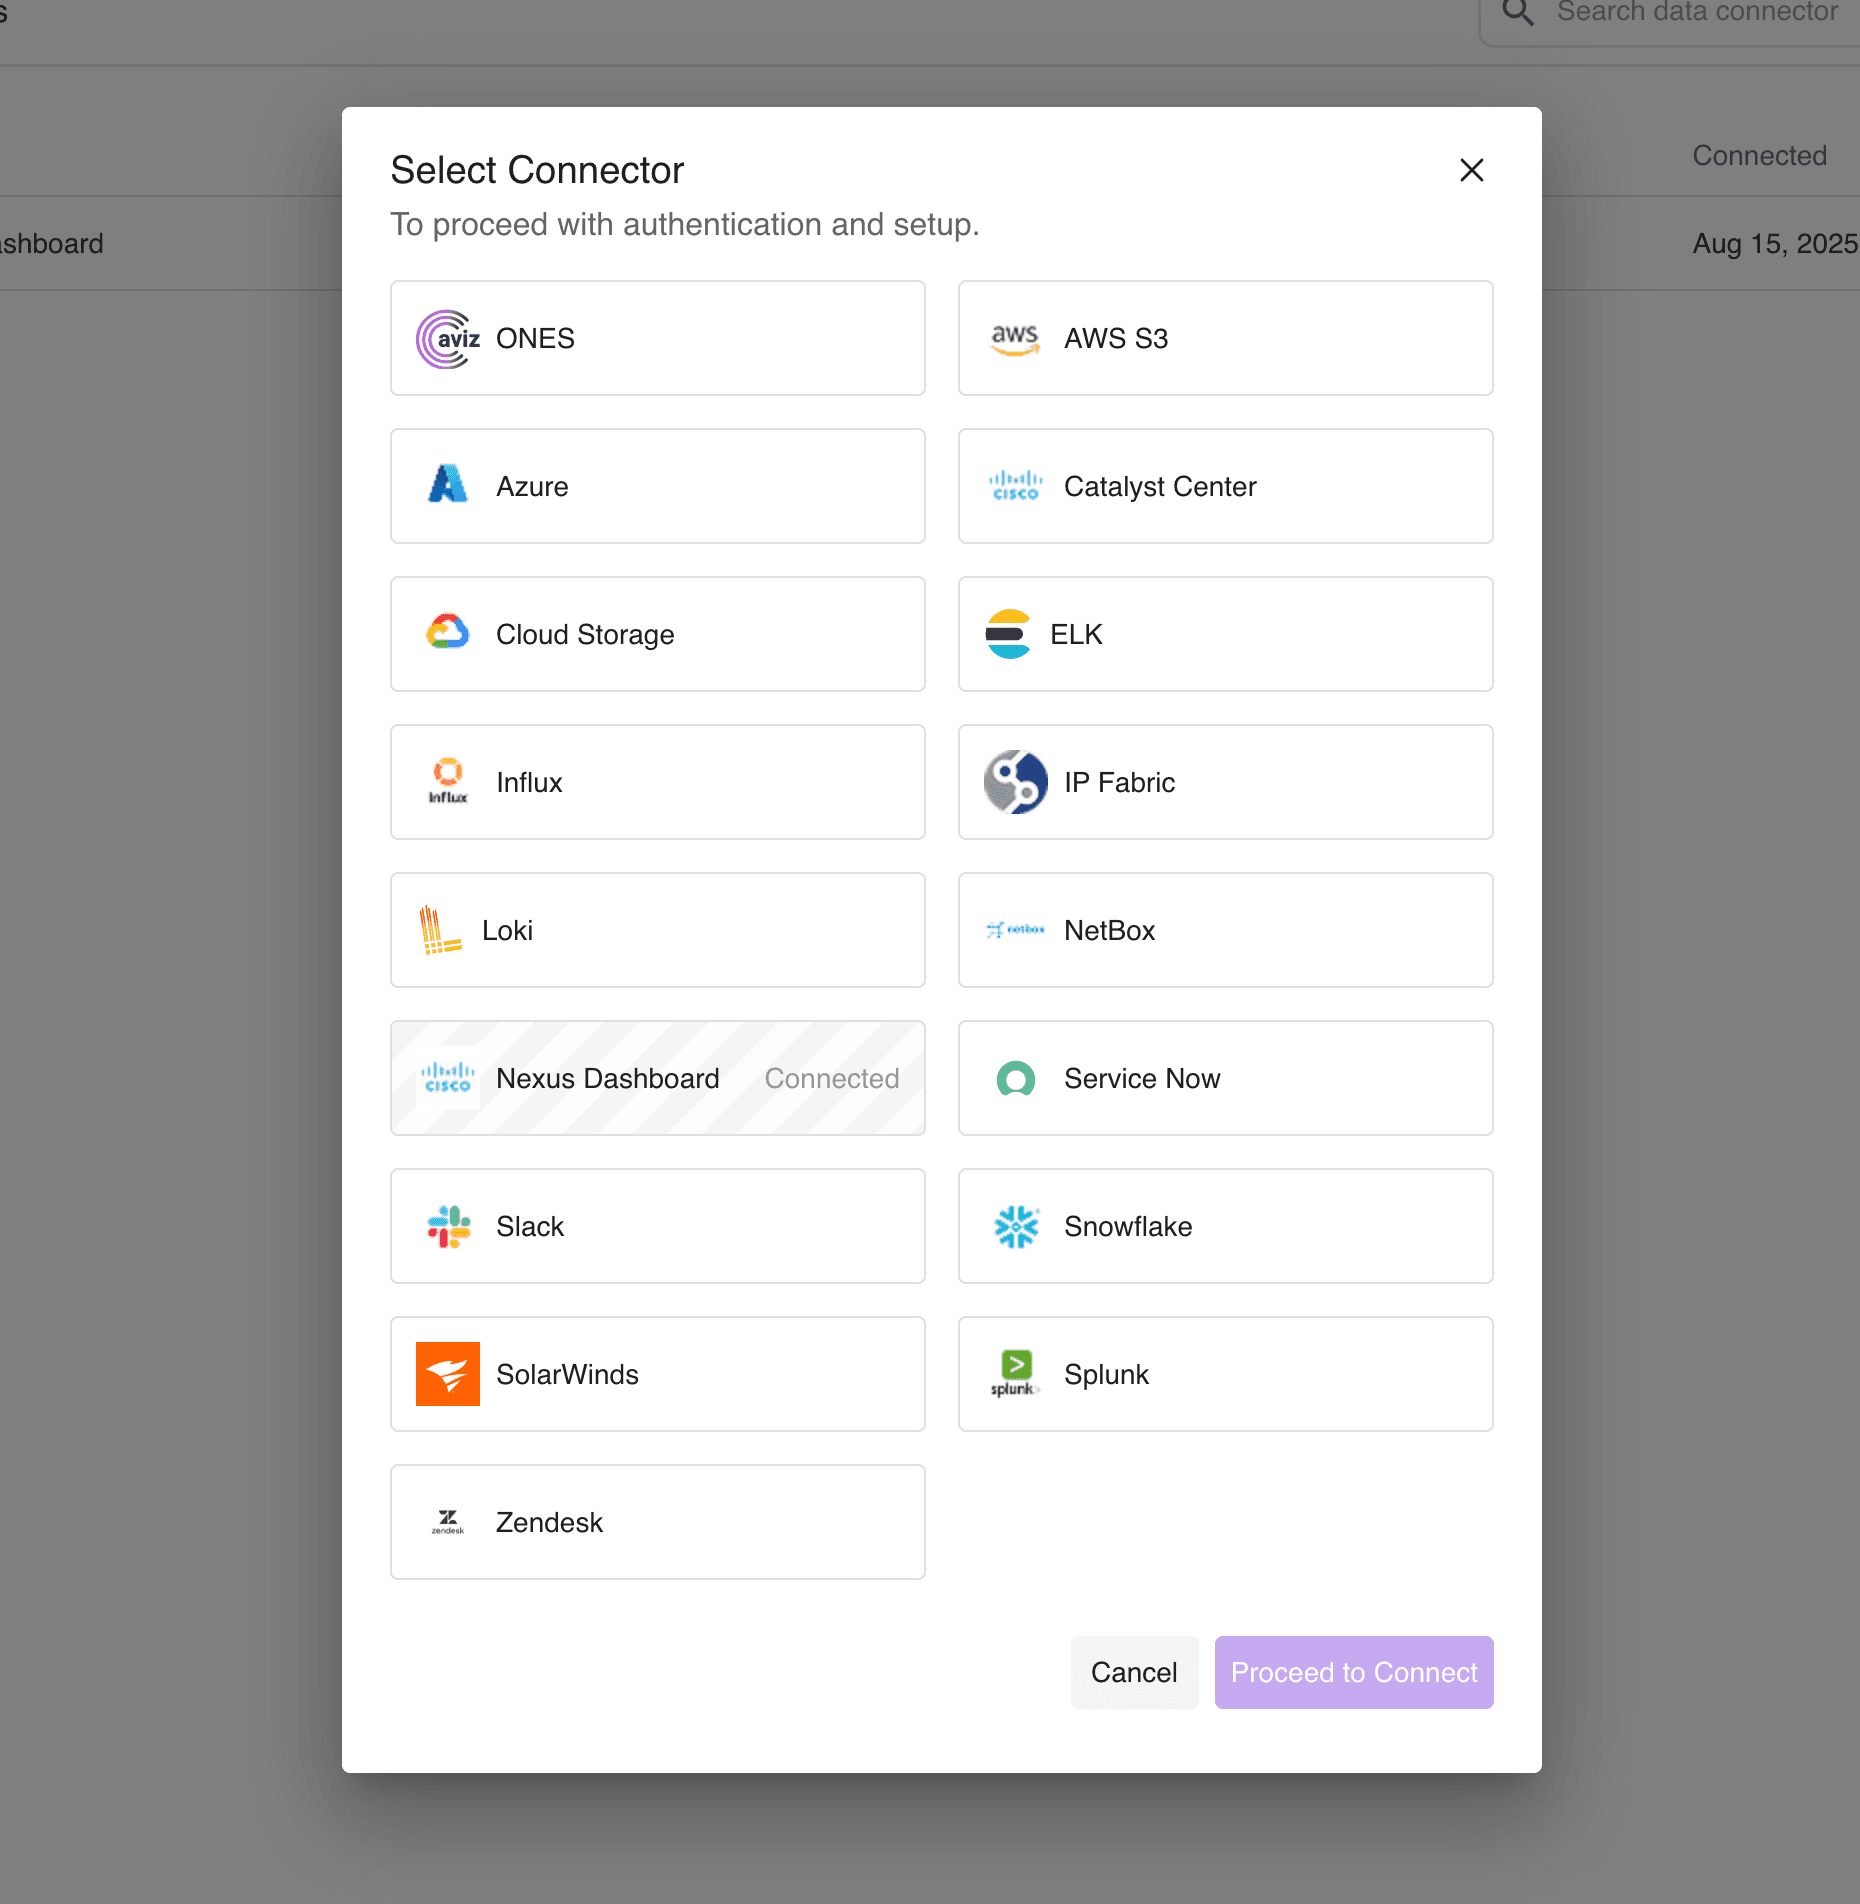
How does Nexus Dashboard integration improve network operations?
It centralizes network data from Nexus Dashboard into Copilot, enabling real-time queries, tag-based filtering, and AI-driven insights for faster, smarter decisions.
With the Nexus Dashboard connector, Copilot does more than store your ND data. It makes it actionable.
-
Real-Time Inventory Data :
Continuously syncs clusters, nodes, switches, and interface details.
-
Live Health & Performance Metrics :
Pulls CPU, memory, fan, PSU, interface admin/oper states, and counters.
-
Contextual Queries with Tags :
Focus on the exact devices or fabrics you care about.
Example Query
!nexus List all devices in my network
This returns only Nexus Dashboard devices. You can also group connectors under a shared tag like core-inventory to query multiple sources at once.
What are the main use cases for this integration?
Two primary use cases are supported right out of the box: NetOps monitoring and inventory insights.
- Basic NetOps: Monitor interface changes (admin/oper status) and device software upgrades.
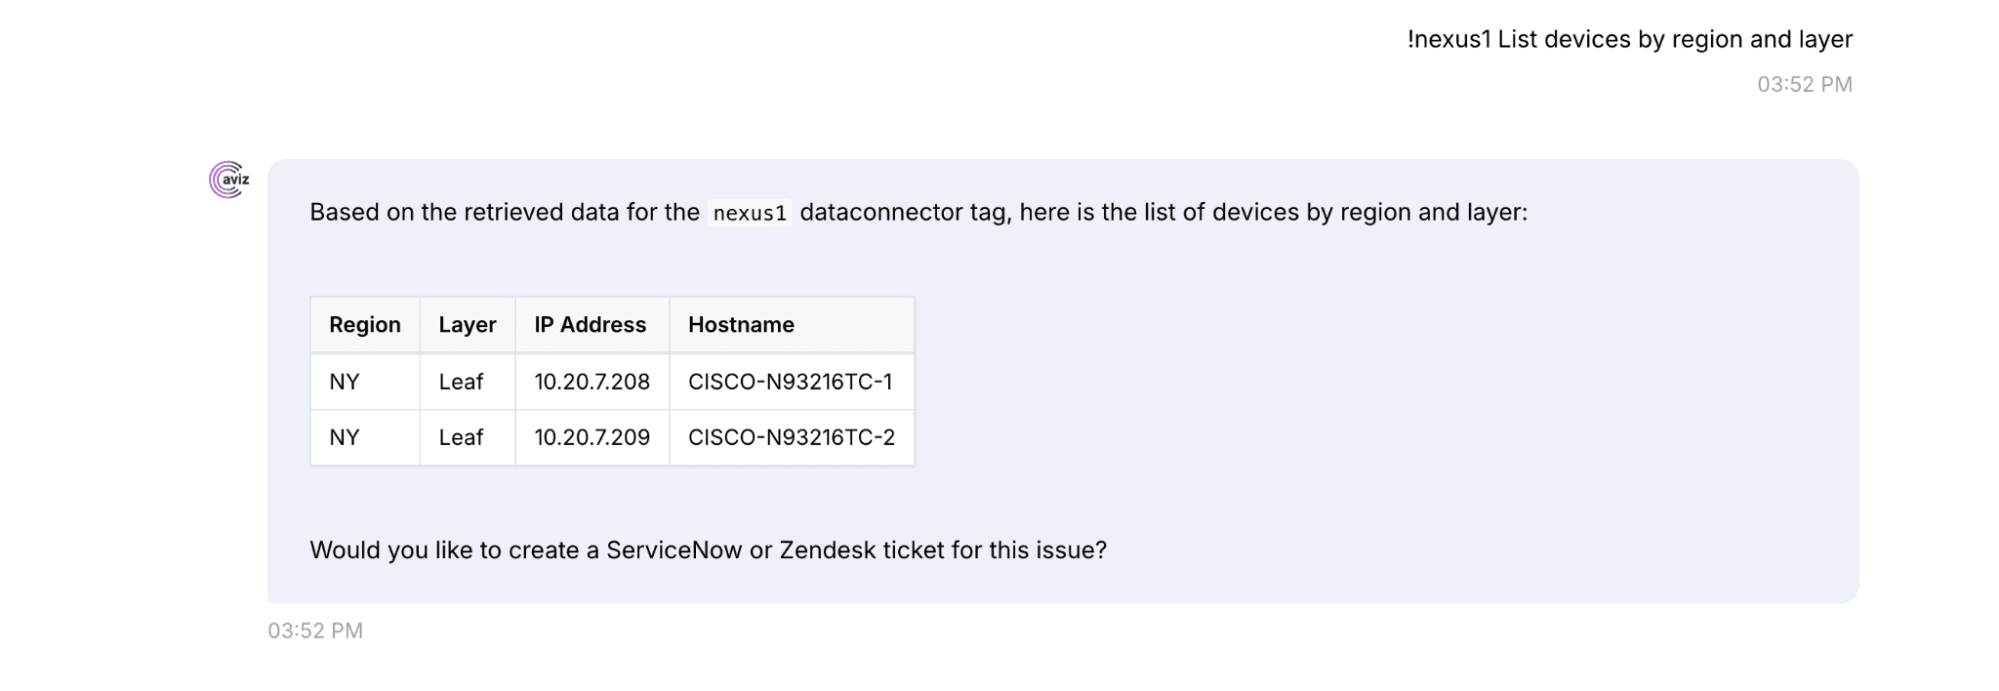
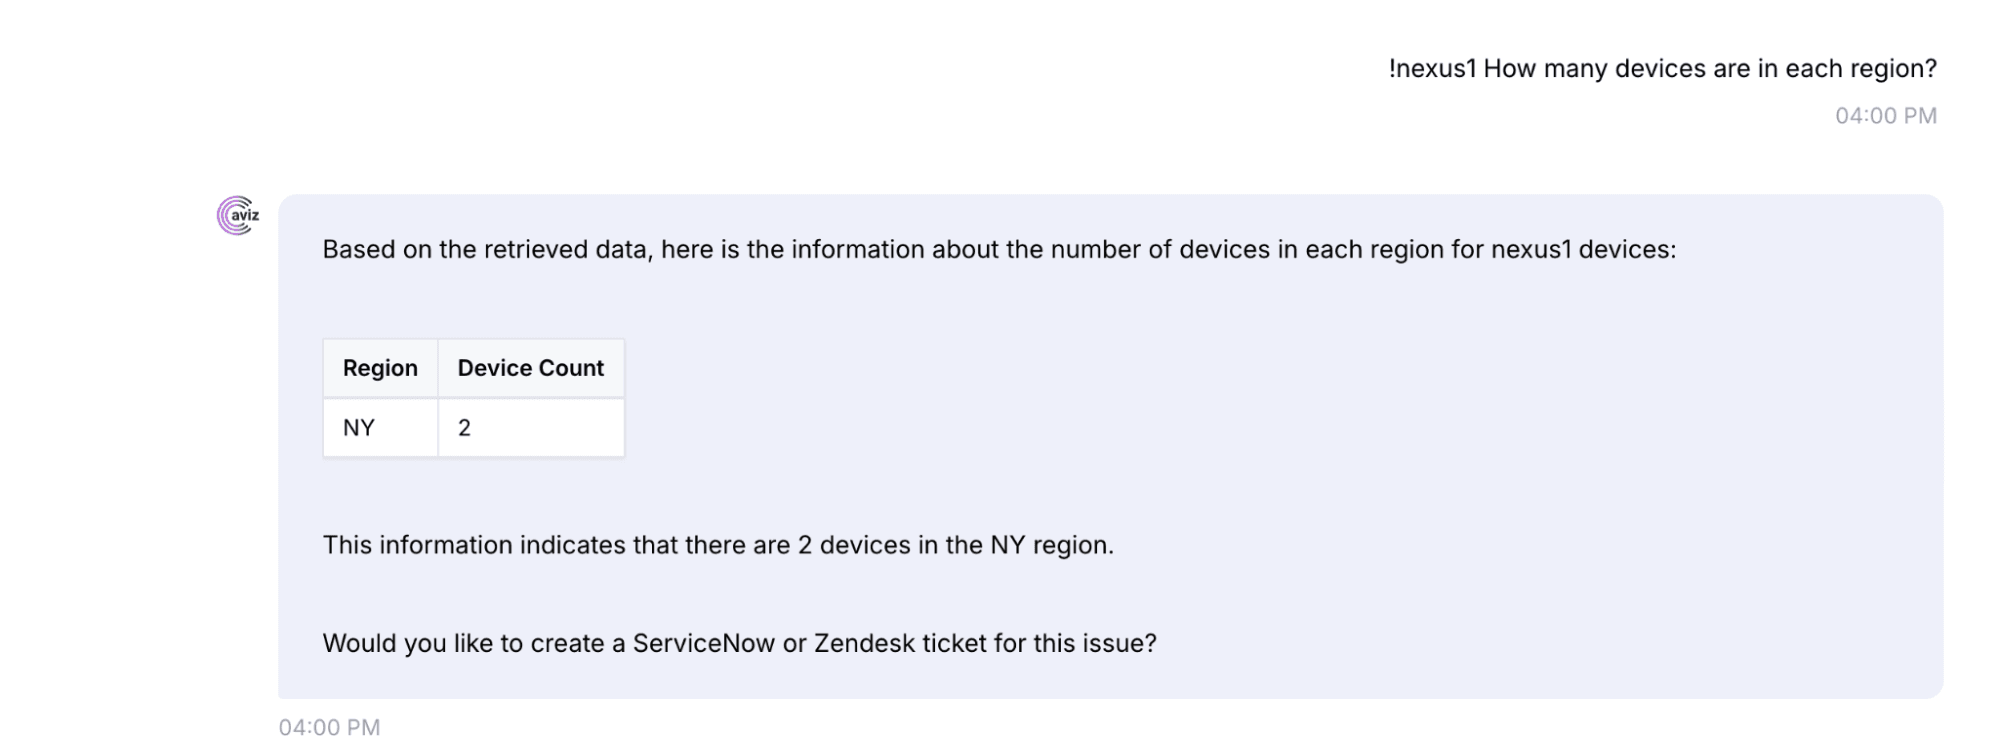
- Inventory Insights: Search, group, and count devices by region, hardware SKU, OS version, layer, and more.
How does the Nexus Dashboard connector work behind the scenes?
When onboarded, the connector securely fetches ND data, streams it into Copilot, and normalizes it for unified queries with other data sources.
- Secure Authentication: Provide ND credentials or an API token.
- Collector Launch: A backend container calls ND APIs like
/login,/allswitches,/getSensors. - Data Streaming: Inventory and metrics are pushed into Kafka topics for processing.
- Schema Normalization: Data aligns with Copilot's unified model for seamless querying alongside Splunk, Syslog, and other connectors.

How does this integration benefit my NetOps team?
It saves time, increases operational awareness, and enables proactive decision-making by turning siloed ND data into actionable insights.
- Detects reboots or interface changes in real time.
- Analyze device distribution by region or fabric.
- Plan network capacity proactively.
Before vs After Integration:
| Challenge | Before | After |
|---|---|---|
| Access to ND data | Locked in ND UI | Directly queryable in Copilot |
| Multi-source correlation | Manual, time-consuming | Unified results with tags |
| Scope filtering | All or nothing | Tag-based filtering per connector/group |
| Operational awareness | Reactive | Real-time updates + AI prompts |
What types of metrics does Copilot ingest from Nexus Dashboard?
Copilot tracks devices, interfaces, performance, traffic, environmental health, and hardware details for comprehensive AI-powered visibility.
- Device Properties: Hostname, IP address, OS version, model, uptime.
- Interface Configurations: Admin and operational states, continuously updated.
- Performance Metrics: CPU and memory utilization.
- Traffic Flow: Throughput, errors, and discards.
- Environmental Health: Fan and PSU status.
- Hardware Details: Installed modules, optics, manufacturer info, and serial numbers.
How Copilot Prompts Reveal Nexus Dashboard Details
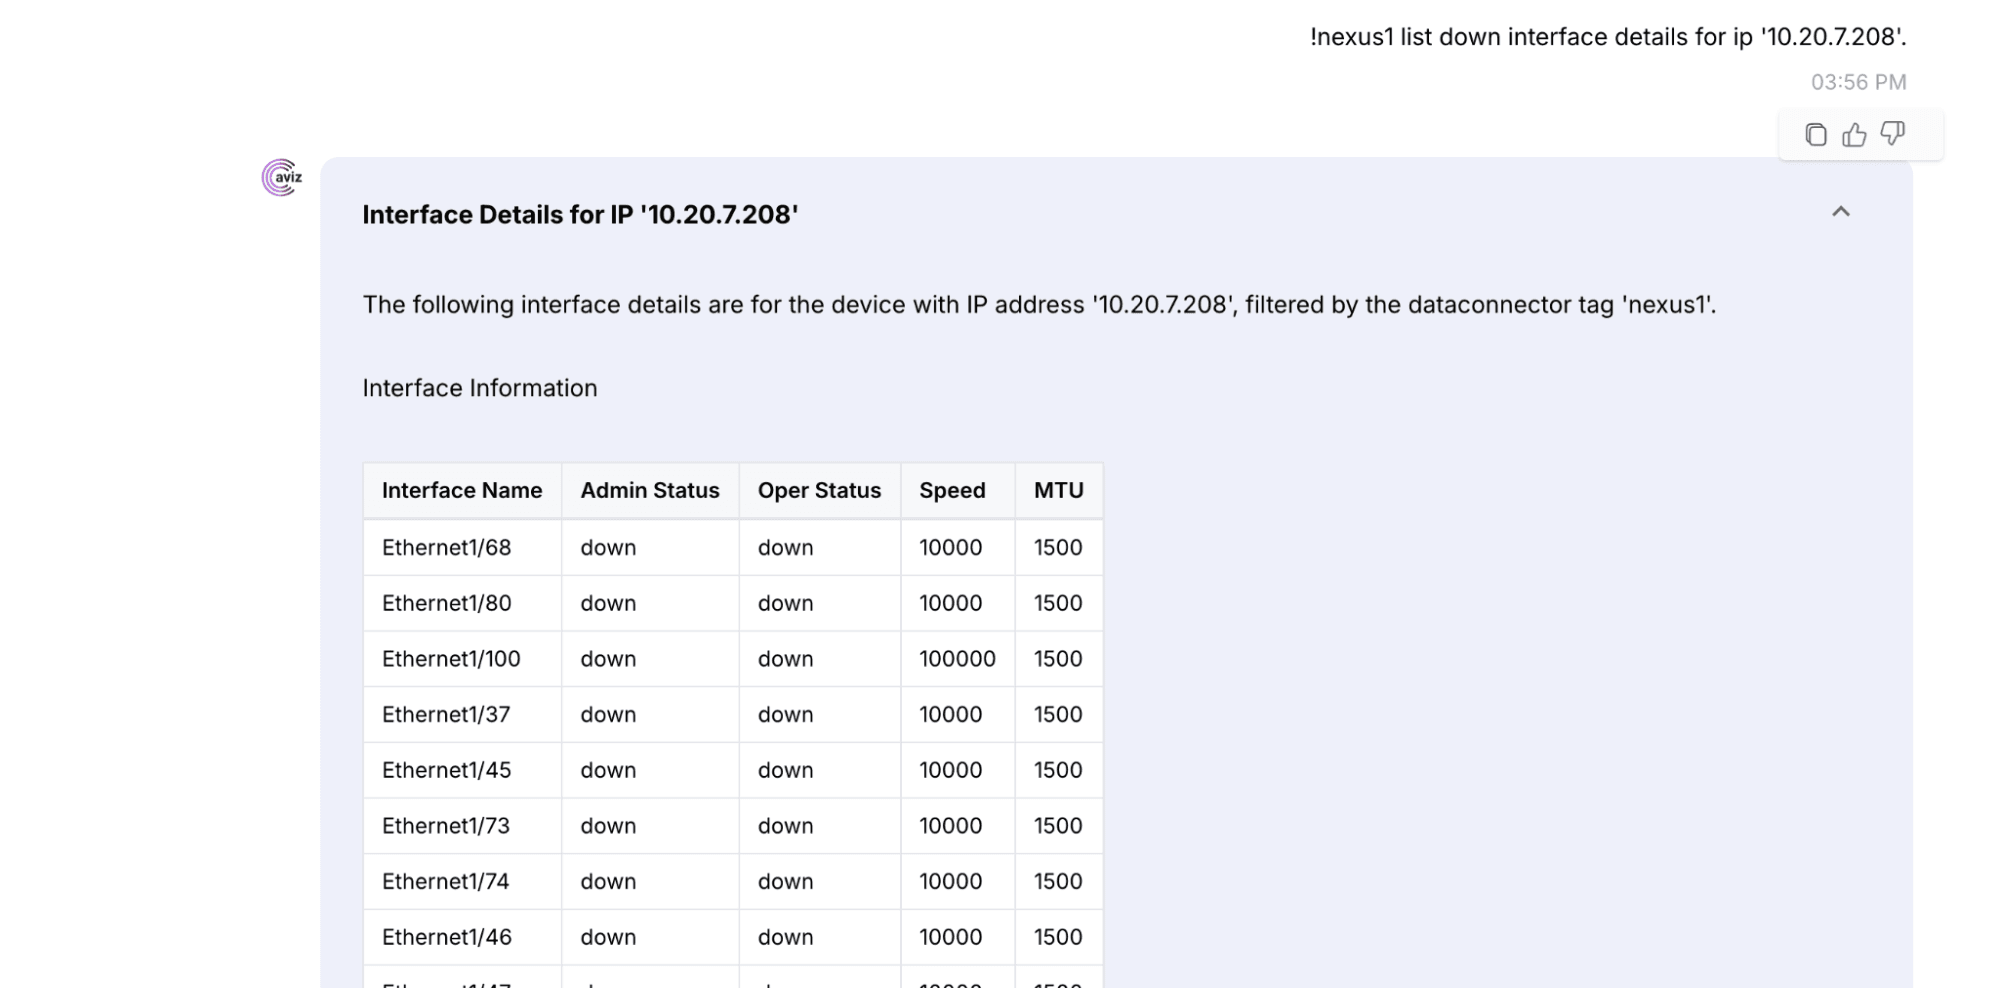
Network Copilot allows you to run prompts that query Nexus Dashboard devices directly, providing detailed inventory and interface information in real time.
Conclusion
Networks do not lack data; they lack context, timeliness, and the ability to act quickly. Integrating Cisco Nexus Dashboard with Network Copilot ensures inventory, health metrics, and performance counters are searchable, tag-filtered, and AI-ready.
Teams spend less time hunting through dashboards and more time solving problems. Whether it's spotting a reboot, analyzing device distribution, or planning capacity, Copilot turns Nexus insights into actionable decisions instantly.
At Aviz Networks, we believe connectors should do more than move data. They should elevate it, turning telemetry into living, searchable knowledge that scales with operations.
Experience Real-Time, AI-Powered Network Visibility
Book a demo with Aviz Networks to see how Network Copilot transforms Cisco Nexus Dashboard data into actionable decisions.


