





Understanding Cisco Catalyst Center in Network Copilot: From Fragmented Assurance to Unified Intelligence
 April 16, 2026
 Network Copilot ™

TL;DR
Workspaces filled with siloed Cisco Catalyst Center data slow down troubleshooting and decision-making. Network Copilot combines center assurance data, inventories, and topologies to offer real-time insights, paving the way for faster troubleshooting and easier network operations.
Introduction
Downtime in enterprise and data center networks can lead to an immediate loss of revenue. The difference can be as small as being able to notice a problem and being able to act on it. Many traditional troubleshooting tools split critical context across several different systems, leading to health metrics being in one system and topology in yet another. The end result is slow troubleshooting and a lot of reactive firefighting.
The Cisco Catalyst Center Collector for Network Copilot addresses this by streaming assurance and inventory data directly to the Copilot workspace. By streaming Catalyst Center’s inventory, health metrics, interface counters, and topology data to Network Copilot, teams have access to real-time data that they can query. Network Copilot reduces the need for time-consuming data exports and dashboard switching and provides assurance insights directly in the workspace.
What is Catalyst Center integration and why is it important?
Catalyst Center integration combines assurance, inventory, and telemetry data into a single AI workspace and makes them actionable and queryable.
Catalyst Center, formerly DNA Center, is Cisco’s network automation and assurance system. It provides rich context and telemetry, but that context is often siloed.
Network teams used to face many problems before Catalyst Center integrated with Network Copilot:
Fragmented context. Inventory, CPU, and topology data were all separate.
Workflow inefficiencies. Teams were having to spend time clicking through interfaces or making repeated API calls.
Proactive network operations and troubleshooting. This was only possible after the impact was experienced or reported.
Catalyst Center solved the above problems by:
Creating a real-time workspace for assurance data, with the help of AI.
Answering questions in plain English, not API requests.
Using tags as a method of scoping and combining data across various sources.
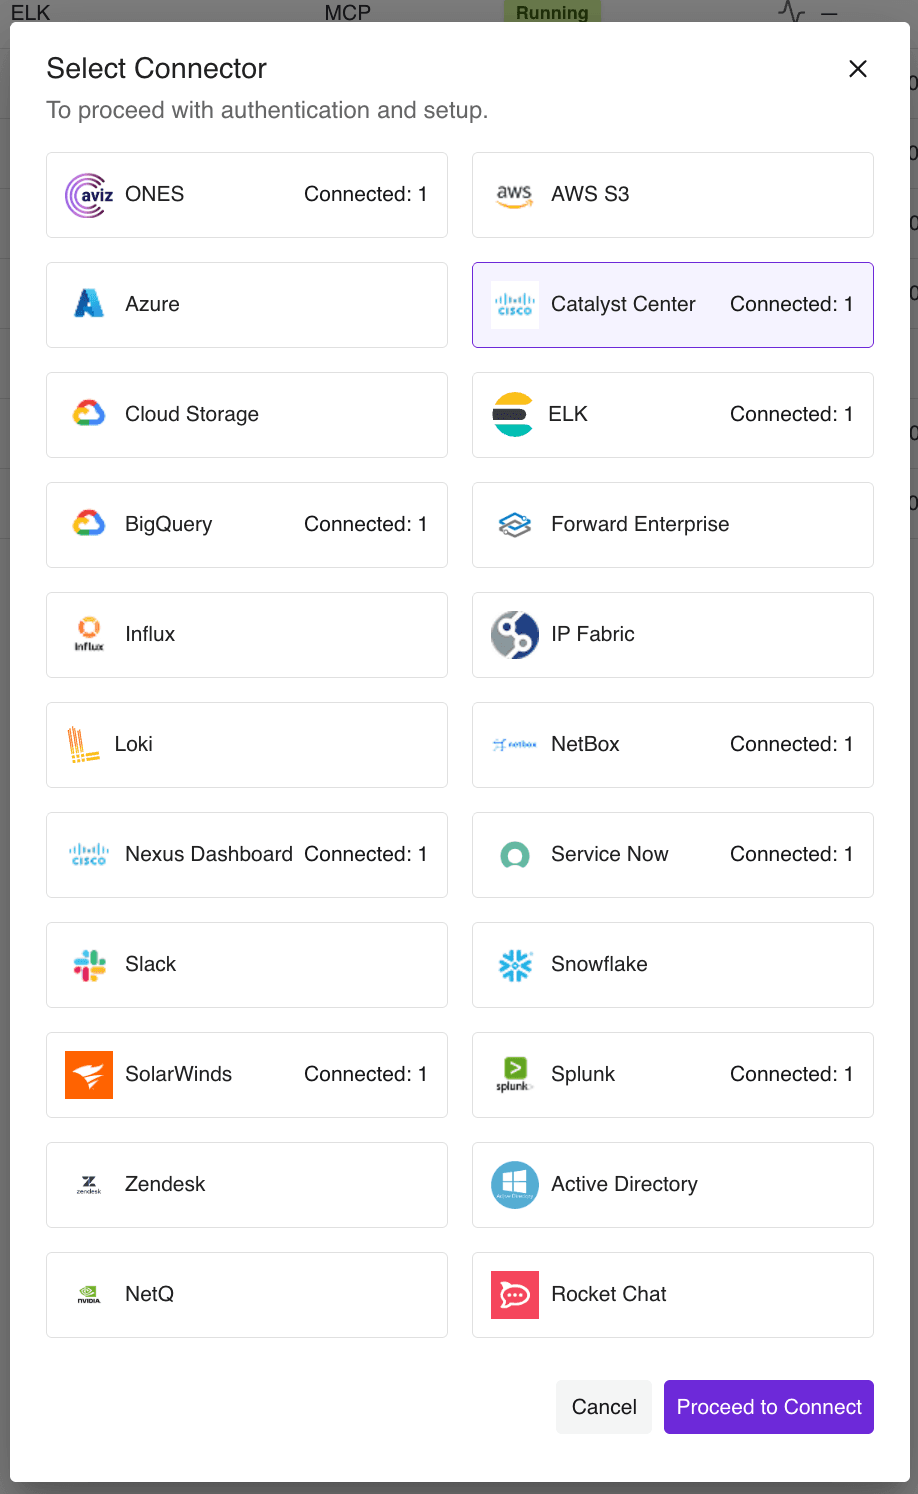
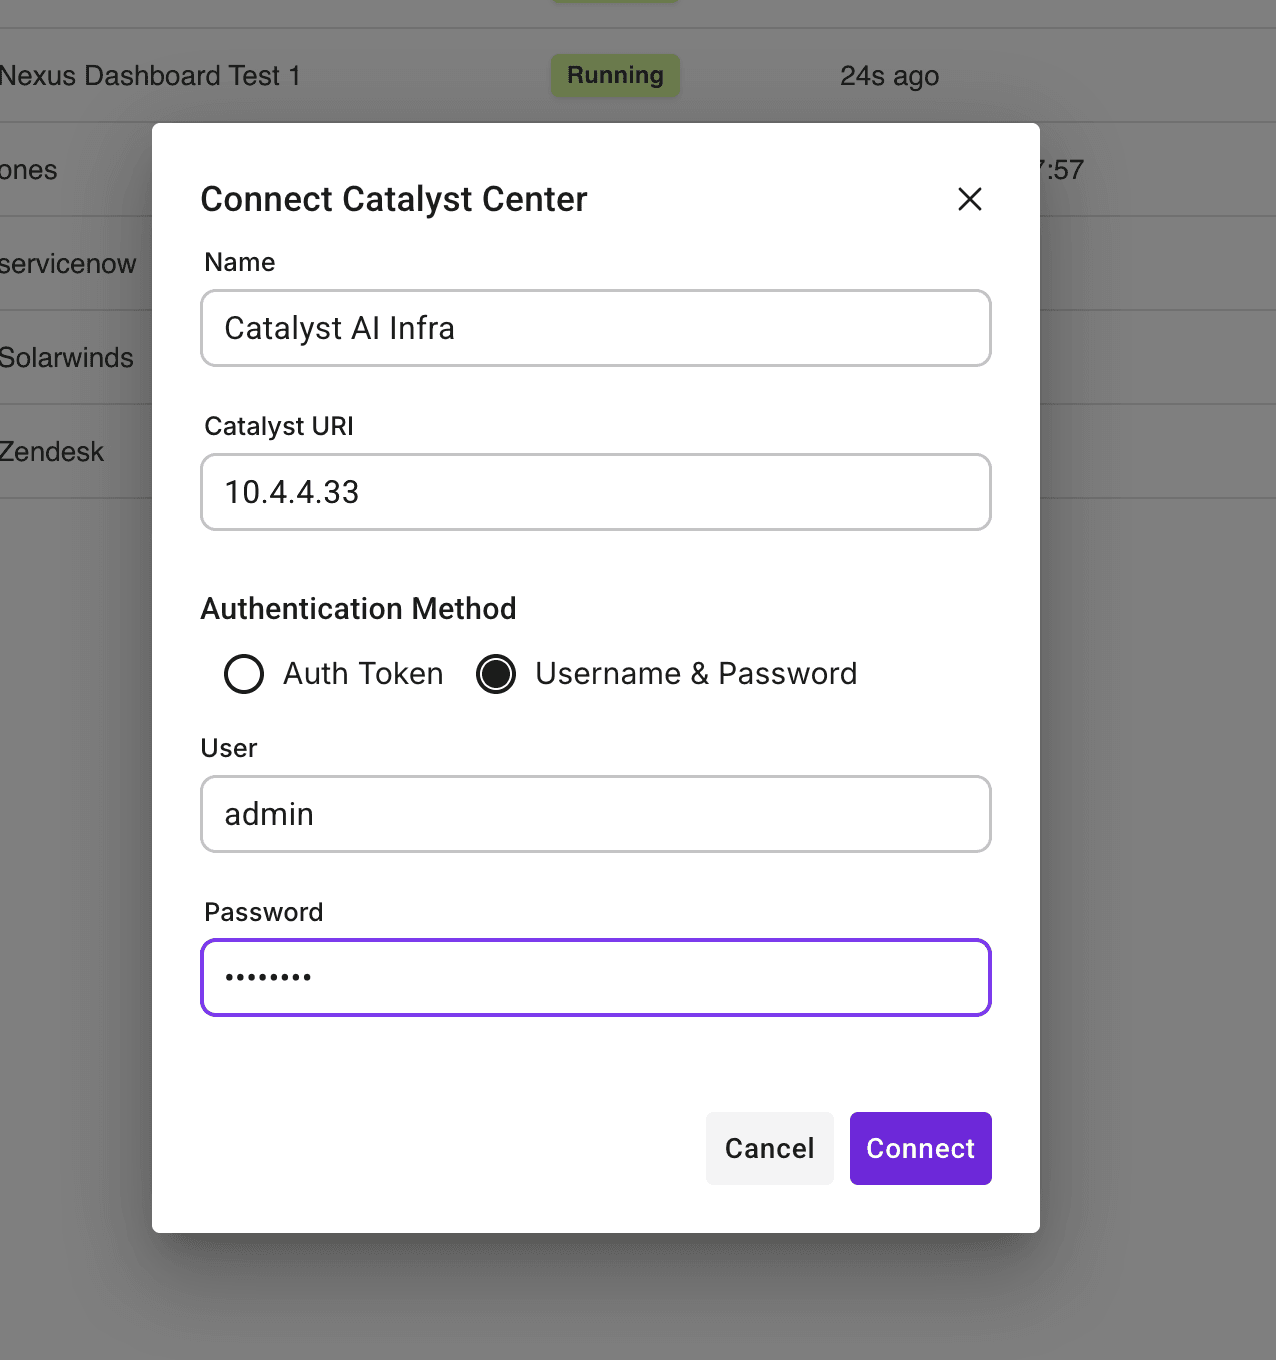
What benefits does this bring to teams?
This brings automation and visibility to network operations with the ability to ask questions in natural language.
Basic NetOps: Automate checks and monitoring.
Example commands:
- !catalyst-core Are there any switch reboots in the last 24 hours?
- !catalyst-core Show devices with changed operational status.
- !catalyst-core Show interfaces with changed Admin status.
Inventory Insights: Visibility of network assets.
Example commands:
- !catalyst-core Show all Catalyst devices with their Hostname, IP, and MAC.
- !catalyst-core How many Catalyst devices are in each site?
- !catalyst-core Show the different HWSKUs in my network.
- !catalyst-core Show the speed and type of all interfaces on device ID 1234.
Health and Assurance Insights: Proactive performance monitoring.
Example commands:
- !catalyst-core Which devices have high CPU in the last 24 hours?
- !catalyst-core Show devices with memory utilization for the last 24 hours.
- !catalyst-core Show devices with critical health status.
- !catalyst-core Show interfaces with high error and discard rates.
Topology Awareness: Knowledge of dependencies and failures.
Example commands:
- !catalyst-core Show the physical topology for datacenter-east.
- !catalyst-core Show links that are down in my Catalyst fabric.
Flow and Assurance Correlation:Ability to connect multiple data sources.
Example commands:
- !catalyst-core Show interface errors and traffic for the last 1 hour.
- !catalyst-core Did any links flap in the peak flow hour of yesterday?
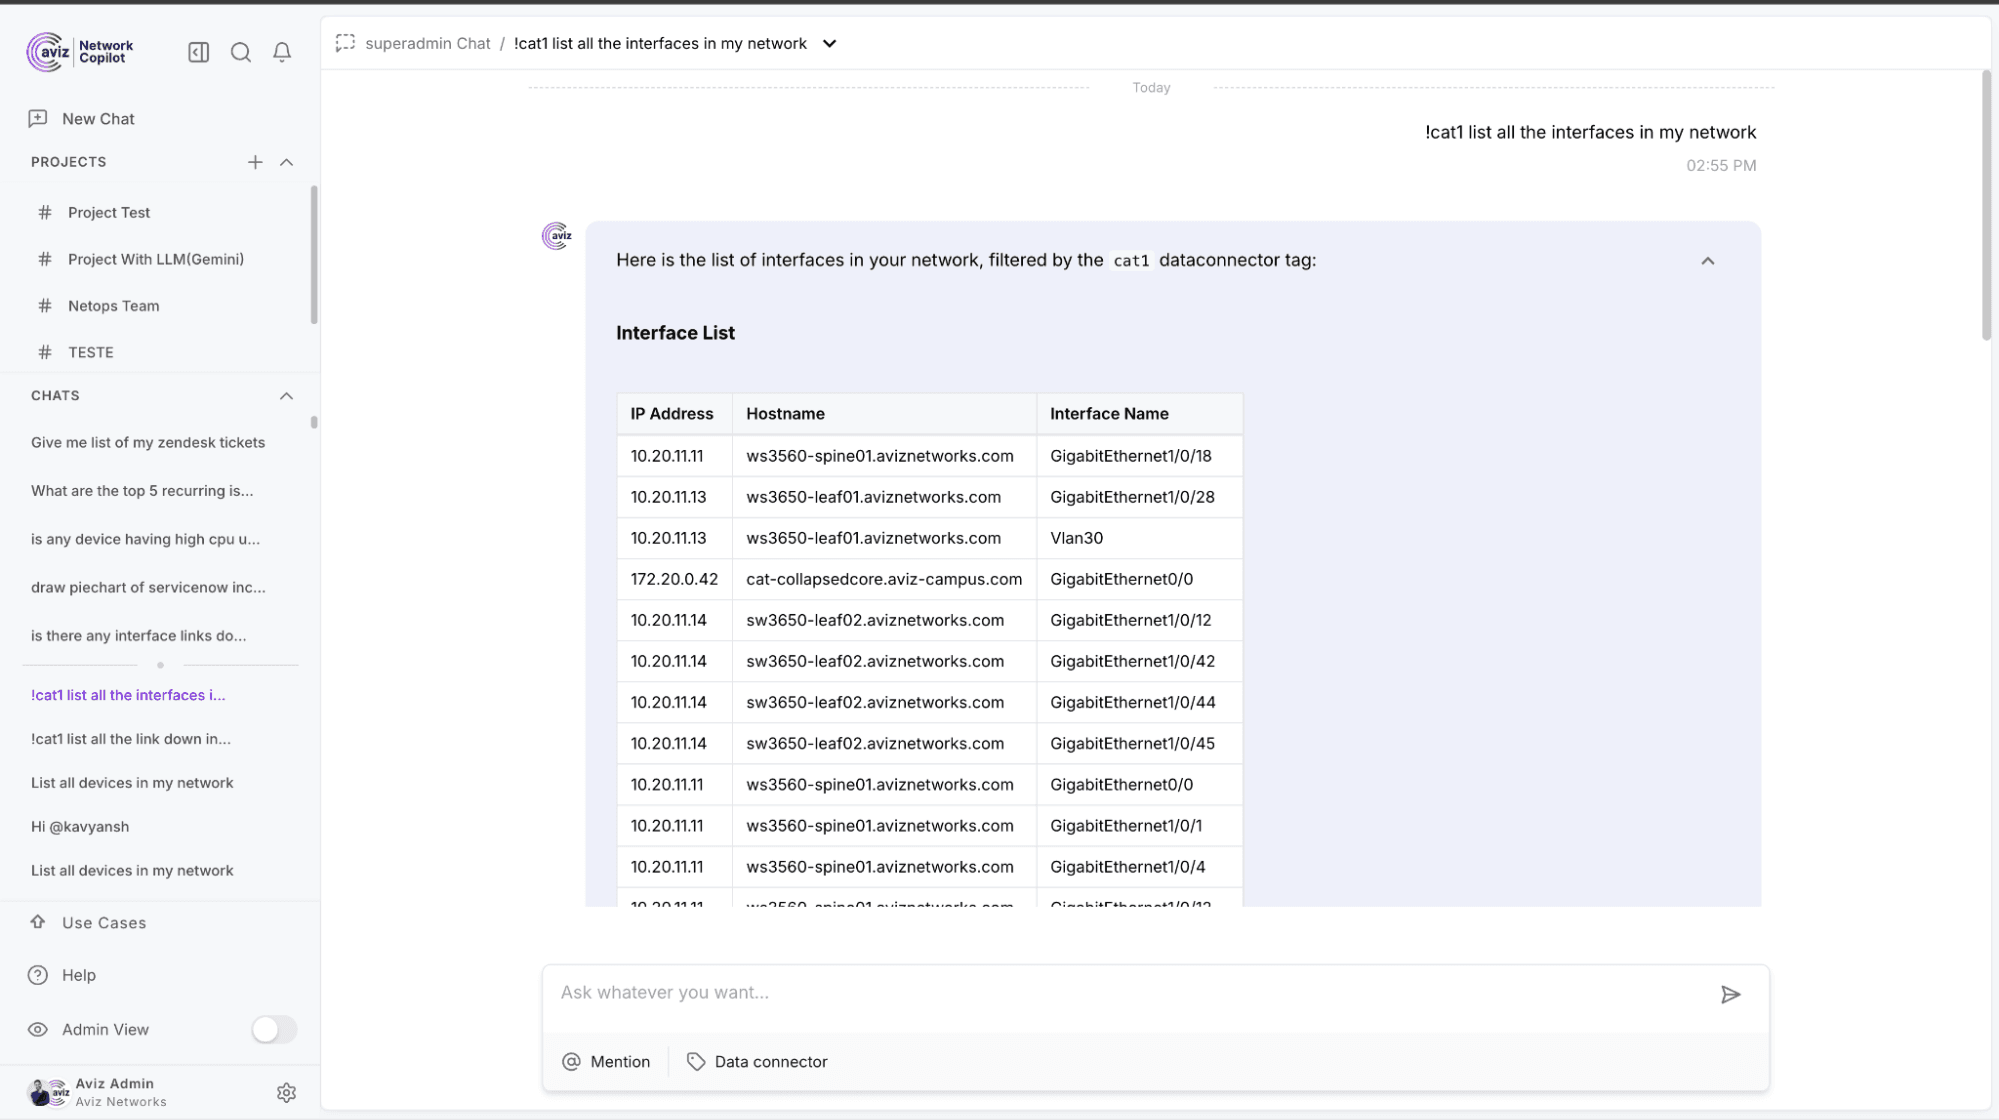
What happens behind the curtain?
- Secure Authentication — Network Copilot uses either user credentials or access tokens to authenticate against the Catalyst Center APIs.
- Collector Container — A dedicated Catalyst collector runs as a microservice and polls Catalyst APIs as per the defined schedule.
- Data Streaming to Kafka — Device inventory, interfaces, CPU and memory health, interface counters, and topology are streamed to their respective Kafka topics.
- Normalized Schema — This aligns the data with Network Copilot’s unified model and supports queries across all connectors. With this normalization, you can query Catalyst data together with syslogs, flows, and inventory data from different connectors.
Why does this matter for your team?
| Challenge | Before | After |
|---|---|---|
| Device assurance visibility | Locked in Catalyst UI | Directly queryable in Copilot |
| CPU/memory checks | Manual drilldowns | Real-time AI answers |
| Interface counters | CSV/API exports | Instantly accessible via prompts |
| Topology maps | Static visuals | Live, queryable topology data |
| Multi-source correlation | Manual stitching | Unified insights with tags |
What Catalyst Center data does Network Copilot capture?
Structured telemetry data regarding identity, performance, and topology is ingested.
For device identity and software info, Network Copilot ingests details including hostname, management IP, MAC address, serial and model number, OS version, and device uptime.
For interface configuration and state, Network Copilot ingests interface name, administrative and operational state, interface speed and MTU, and interface description.
For health and utilization of devices, Network Copilot ingests CPU and memory utilization.
For traffic and quality counters, Network Copilot ingests throughput, input and output errors, and input and output discard counters.
For hardware components and environmental data, Network Copilot ingests data regarding fans, PSUs, modules, and optics.
For topology context, Network Copilot ingests node and link status from topology APIs.
Field names are in the Network Copilot’s normalized schema to guarantee integrated connectors and enable correlation across sources.
Conclusion
Cisco wants you to have much better data and insights with Cisco Catalyst Center and Network Copilot. They (Cisco) want you to have smart and flexible data. Your Cisco tools will no longer work separately and will support a cohesive workplace where everything from inventories to syslogs to flows and assurance will work together.
Frequently Asked Questions
1. What problem does Cisco Catalyst Center data create for network teams?
Cisco Catalyst Center data is often siloed across inventory, assurance, and topology views, which slows troubleshooting, increases manual effort, and leads to reactive network operations.
2. How does Network Copilot improve visibility into Cisco Catalyst Center data?
Network Copilot brings Catalyst Center assurance, inventory, interface counters, and topology data into a single AI-driven workspace, making it continuously updated, queryable, and easier to act on.
3. What is the Cisco Catalyst Center Collector for Network Copilot?
The Catalyst Center Collector is a dedicated microservice that securely connects to Catalyst Center APIs and streams inventory, health, interface, and topology data into the Network Copilot workspace.
4. What types of data are ingested from Cisco Catalyst Center into Network Copilot?
Network Copilot ingests device identity, software details, interface configuration and state, CPU and memory utilization, traffic counters, hardware components, and physical topology context.
5. How does Catalyst Center integration reduce manual network operations?
It removes the need for multiple dashboards, CSV exports, and API calls by enabling natural language queries directly against Catalyst assurance and inventory data inside Network Copilot.
6. What operational use cases does this integration enable?
The integration enables automated NetOps checks, structured inventory insights, proactive health monitoring, topology-aware troubleshooting, and correlation across multiple data sources.
7. How does topology awareness help with troubleshooting?
Live topology data from Catalyst Center allows teams to understand node and link status in real time, making it easier to identify dependencies, link failures, and fabric-level issues.
8. How does Network Copilot support proactive health and assurance monitoring?
CPU usage, memory utilization, device health scores, and interface error counters are continuously pulled, allowing early detection of degradation instead of post-impact troubleshooting.
9. How does data normalization benefit cross-source correlation?
Catalyst Center data is aligned to Network Copilot’s normalized schema, enabling consistent queries across assurance data, syslogs, flows, and inventory from other connectors.
10. Why does bringing Catalyst Center data into Network Copilot matter for teams?
It transforms Catalyst Center from a siloed assurance tool into unified, queryable operational intelligence that supports faster issue resolution, automation, and better decision-making.
Want to simplify your network operations?
Contact Aviz Networks to learn more or request a demo.


