




BigQuery Data Lake for Aviz Network Copilot
 August 17, 2026
 Network Copilot ™
TL;DR
Network Copilot (NCP) Release 1.7.0 introduces Google BigQuery as the data lake for large-scale network analytics. This release builds on the BigQuery connector featured in NCP Release 1.6.0. It uses the multi-source network data BigQuery houses for AI model training and includes device and interface inventories, time-series data on the environmental and performance metrics, and network and service topology.
Operations teams no longer need to combine five to ten monitoring tools to analyze the network. Now, they can communicate their queries to NCP naturally, for example, “show me anomalies in my network.” NCP learns normal behavior for every device and signals deviations to the norm. NCP even summarizes the cause for every signal and the summary is formatted to post directly to an issues ticket.
Introduction
Today’s networks have devices from a bunch of different vendors and cloud services that are also spread out. The data for the operational networks that have devices describing how the network is performing and how the devices are connected is often located in different places. Because of this, operational teams have to handle multiple tools and different interfaces to manage network inventory, perform user actions on the network, manage alerts, and view the current network topology. The connection points for these disconnected systems create integration blind spots.
The BigQuery Data Lake use case in NCP R1.7.0, removes integration blind spots. In this use case, a BigQuery Data Lake introduces BigQuery Data Sets that bring together nearly all operational data domains. With this use case, AI Agents can be assigned tasks within this Data Set. Instead of sorting through large volumes of telemetry data, engineers can ask questions directly and get responses from the telemetry data.
What Is the Significance of a BigQuery Data Lake Concerning Network Operations?
It’s tough to find the costs of working with splintered operational data. Incident responses take longer because the engineer on-call will overlook data in the tool that he or she doesn’t think to check. Data doesn’t align which makes planning capacity more of a practice of making guesses. Static limits of anomaly detection techniques become “if latency is over 50ms” and cause teams to miss the meaningful alerts while getting buried in a mountain of alerts.
Static thresholds are actually an even larger issue. For one router and on a Tuesday at 3 in the afternoon, a reading of 60% CPU usage could be totally fine. But at 3 am in the morning, that could be a major critical problem. A single global rule isn’t able to tell that difference. That’s the reason thresholds are either too loose which causes a lot of significant issues to get missed, or are set very high causing operators to hit a wall, completely burned out. Operators actually require a system able to independently assess the state of each individual component within the system, and then give context for when a significant change has taken place.
How Does a BigQuery Data Lake Help Operations Teams?
- One source of truth – Inventory, telemetry, topology, and probe-based performance data live together in a single BigQuery dataset, so cross-domain questions have a single place to resolve.
- No threshold tuning – NCP builds statistical baselines from historical telemetry and flags deviations automatically, with no rules to define or maintain.
- Plain-language access – Precise technical prompts and informal questions alike, such as “which interfaces are running hot?” are interpreted and answered correctly.
- Fast answers over large data – Pre-computed baselines keep responses quick and consistent even across very large time-series volumes.
- From detection to diagnosis – When an anomaly surfaces, NCP can run a full diagnostic playbook and return a structured root-cause summary.
What Is the BigQuery Data Lake Approach?
At the center of the use case is a unified data model that represents a network’s operational reality across eight core entities:
| Domain | Tables | What it captures |
|---|---|---|
| Inventory | Devices, Interfaces | The master registry of every managed router, switch, and firewall, and the full catalog of ports and logical interfaces on each. |
| Topology | Network, Service | How devices and interfaces connect via circuits, and how those circuits map to customers, VPNs, VRFs, and sites. |
| Telemetry | Device (CPU/memory), Interface (utilization/errors) | Time-series resource and traffic counters collected at regular polling intervals. |
| Performance & events | Probe IP performance, Alarms/events | Active round-trip-time, jitter, and packet-loss measurements between device pairs, plus the fault and event log. |
Every table references the device registry through a common key, and circuits tie the physical layer to the service layer. That structure is what lets NCP answer questions that span domains: for example, connecting a performance anomaly on an interface to the circuit it carries and, from there, to the customers affected.
What Queries Can You Run on the BigQuery Data Lake?
The BigQuery Data Lake spans a broad range of operational analytics, all driven from chat:
Dynamic baselining and anomaly detection – NCP profiles device and interface behavior using day-of-week and hour-of-day patterns, then flags deviations using 3-sigma statistical bounds and Z-score analysis, with top-N ranking and conversational drill-down. A user can start broad (“show me anomalies in my network”) and progressively narrow to a single device or interface.
Autonomous diagnostic playbooks – When an anomaly is detected, NCP correlates it with topology, related metrics, and service impact to produce a structured root-cause analysis (RCA) summary.
Circuit performance – RTT, jitter, and packet loss across any circuit or device pair, including SLA-oriented views over rolling windows.
Bandwidth utilization – Ingress/egress trends and 95th-percentile utilization by interface or site, with capacity watchlists for links approaching their limits.
Interface health – Error and discard rates, drop percentages, and interfaces showing worsening trends.
Inventory, trends, and charts – Device and interface inventory search, multi-week trend analysis for any metric, and bar, pie, and line charts generated on demand.
A broad opening question is enough to get started. Ask “show me anomalies in my network,” and NCP applies its statistical model, explains what it found, and, when nothing crosses the strict 3-sigma bound, automatically relaxes to a 2-sigma view rather than returning an empty answer.
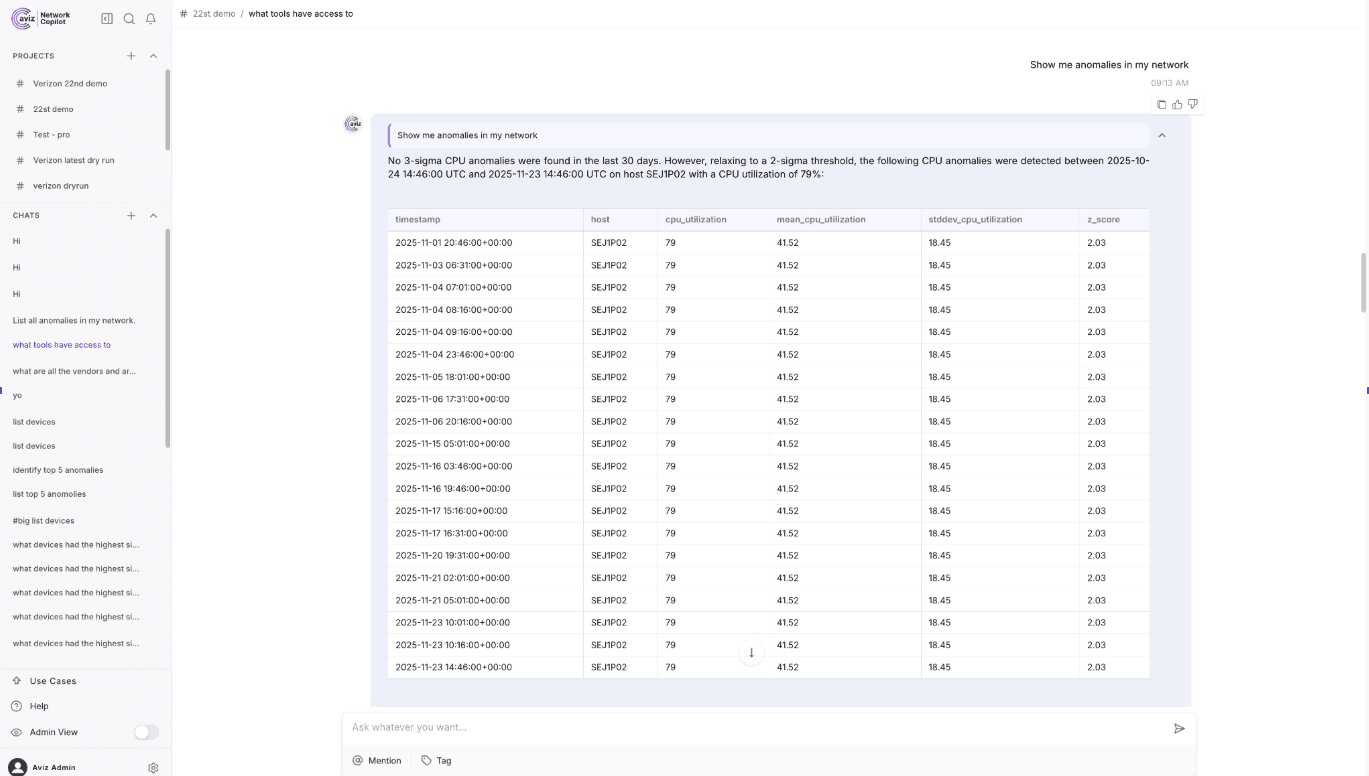
Figure 1: A broad “show me anomalies in my network” query answered with per-reading Z-score analysis NCP surfaces the affected host alongside its mean, standard deviation, and Z-score.
Because the agent understands intent rather than matching keywords, the same answers come back whether the question is phrased as a precise engineering query or an everyday one: and results can be returned as tables or as charts generated on the fly.
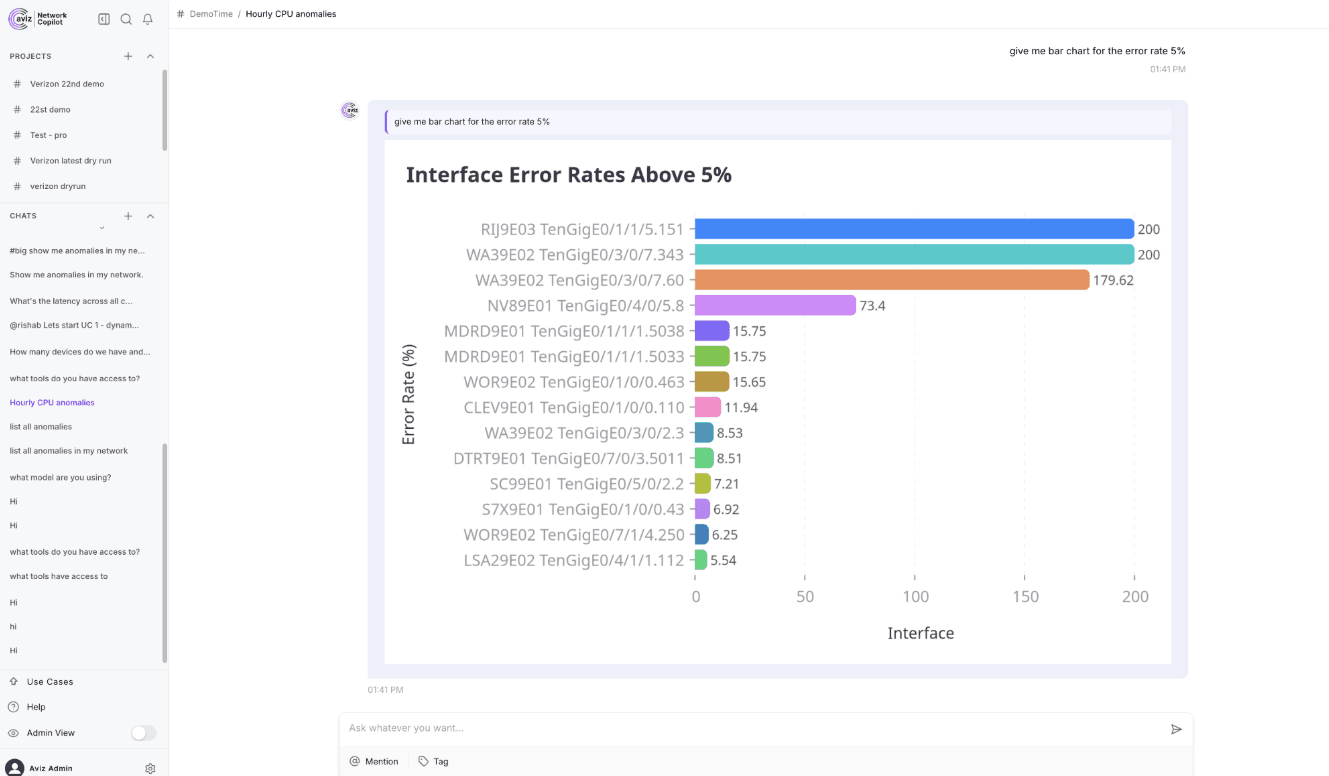
Figure 2: A chart generated directly from a prompt interfaces with error rates above 5%, ranked and rendered inline for quick triage
What Is the BigQuery Data Lake?
NCP is built on a clean three-tier separation of concerns, with each layer doing one job well.
1. Network Copilot UI – A unified, conversational search interface over your private data, with streaming responses and role-based access controls.
2. AI Agent layer – This is where natural language becomes action. The agent classifies intent, plans the query, manages multi-turn conversational context, generates SQL, interprets results, and synthesizes a response, following a consistent loop: parse intent → discover available tools → plan the query → execute → synthesize. It knows the data model, the relationships between tables, and sensible SLA defaults for round-trip time, jitter, and loss, so its queries are grounded in how the network is actually structured.
3. MCP server – A Model Context Protocol (MCP) server bridges the agent and BigQuery, exposing BigQuery’s capabilities as discrete, well-defined tools. It handles authentication, query validation, schema enforcement, result formatting, rate limiting, and cost controls. Just as importantly, it acts as a security boundary. Operations run read-only, queries are constrained to an allow-listed set of tables, and per-query byte and timeout limits keep costs predictable. NCP leverages Google Cloud’s native BigQuery MCP tooling here rather than reinventing it.
4. BigQuery data lake – The bottom tier stores every entity table with partitioning and clustering tuned for analytical queries, and executes the SQL the agent generates.
End to end, data flows from its sources, active probes, SNMP pollers, and syslog, through a streaming ingestion and transformation pipeline into BigQuery, where NCP’s agent reaches it through the MCP server and returns answers to the user.
Getting connected to the BigQuery Data Lake is simple with the usual BigQuery Data Connector (Admin View → Data Connectors → Add Connector → BigQuery). With this method, only a name is required together with a GCP service account key file in JSON. The NCP BigQuery Connector documentation provides full setup information.
How Are Pre-Computed Baselines Utilized By Network Copilot?
A standard technique would consider the original time series data for each query. This technique is time/money consuming. By contrast, NCP retains baseline tables, which store the mean, standard deviation, and 3-sigma thresholds for each device-interface-circuit pair and are pre-calculated on an hourly, weekly, and monthly basis. When an agent has a query, he/she/it retrieves the appropriate baseline. Only in cases where a raw time-series is absolutely imperative for a more complex query, does he/she/it refer to the time-series tables. While allowing the ability to drill down, this system provides fast and steady answers to a system containing many queries.
This design also enables easy and straightforward profiling of hour of day and day of week. A complex query such as differentiating between weekday and weekend behavior is executed in seconds.
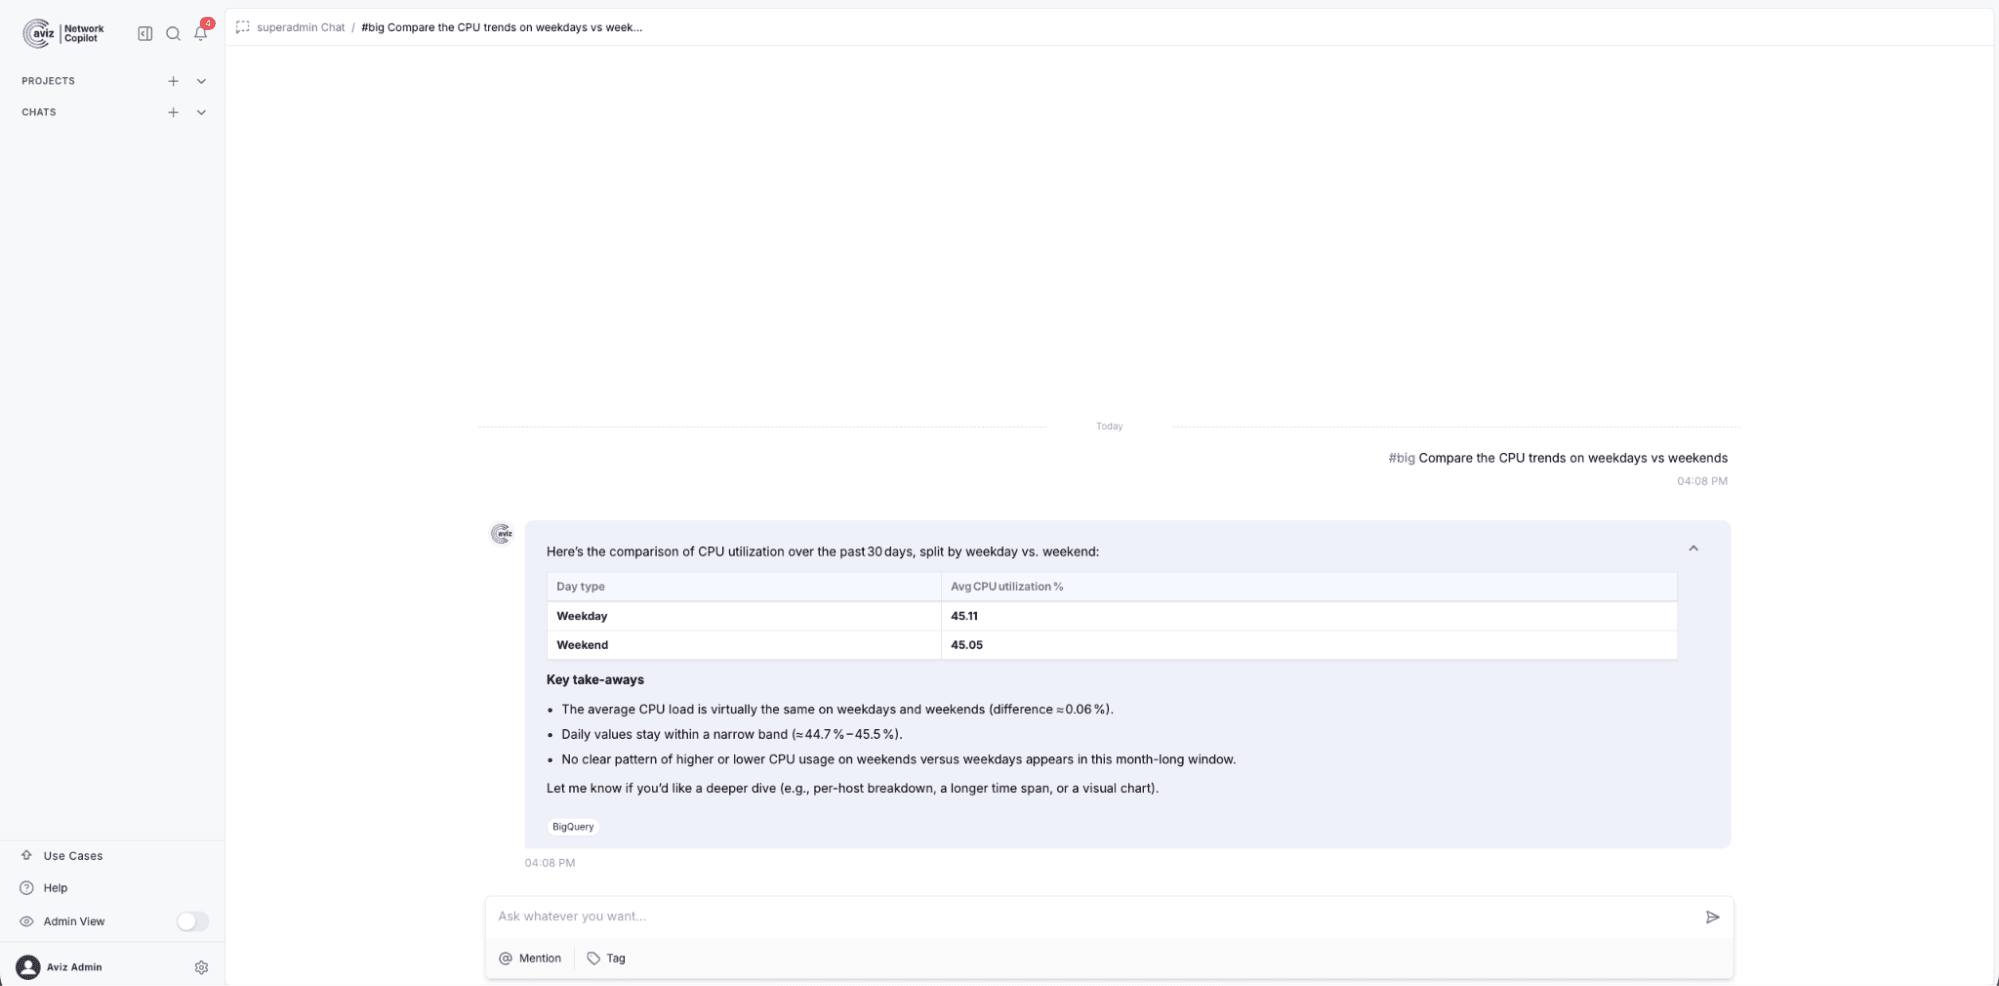
Figure 3: Day-of-week profiling in one prompt average CPU utilization compared across weekdays and weekends over the last 30 days.
How to Leverage the BigQuery Data Lake
To clarify with two examples:
NCP defines nothing. Instead, it trains on historical data to learn the “heartbeat” of every entity and will report the most substantial anomalies stating, “Today, traffic from this device deviated 3-sigma from its expected behavior on Tuesday” (this device’s traffic deviated 3-sigma from its expected behavior on Tuesday). To the perceived anomaly, the agent will run its diagnostic playbook (Perceive → Plan → Act → Summarize) and will correlate the deviation with the topology and relevant metrics and will provide an enriched RCA in the form of a ServiceNow ticket with a brief description and summary.
Through the phenomenon described as “Silent SLA Risk,” when a circuit is failed-over from its primary path to a backup path, performance may, at least for the short term, remain “acceptable” and a SLA has been violated. NCP combines routing-state with performance and service telemetry to avoid these brownouts (the site is “up,” but not SLA compliant). The first step is, as often is the case, the prioritization of circuits by packet loss.
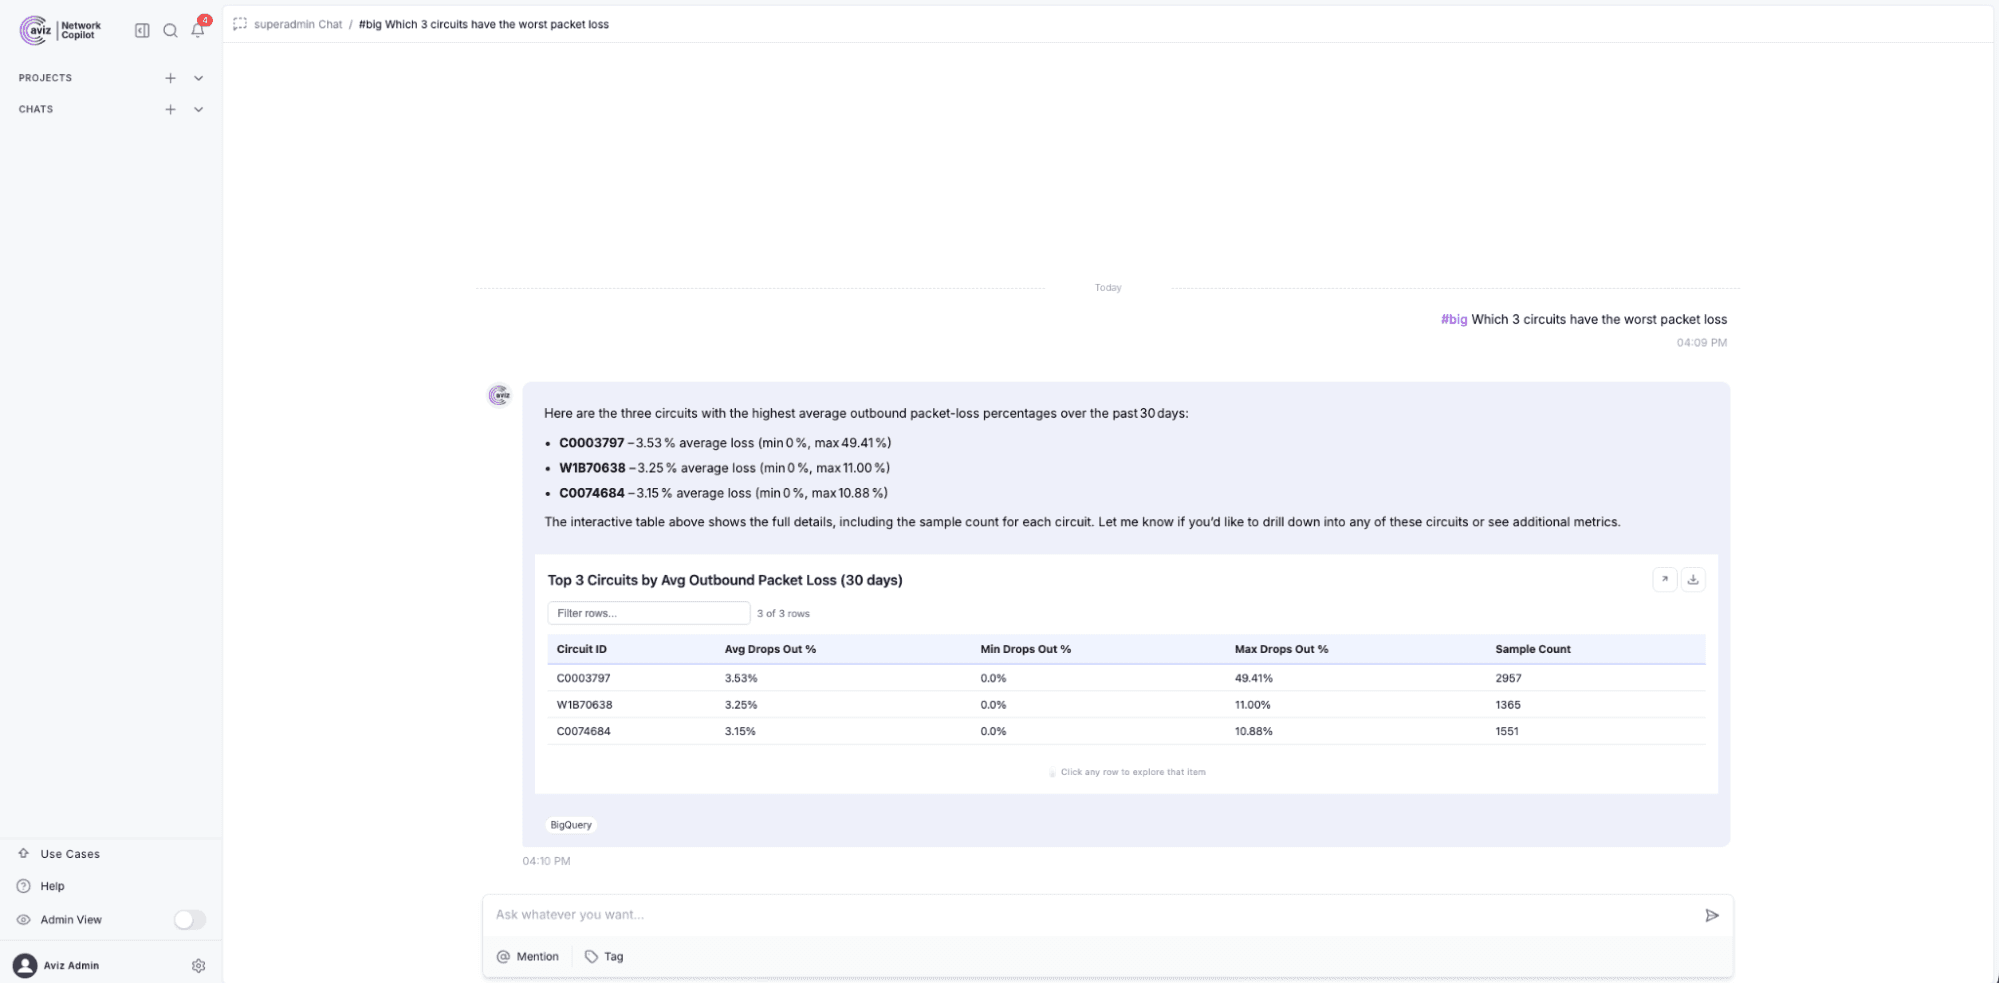
Figure 4: Circuit performance at a glance the three circuits with the worst average packet loss over the last 30 days, ranked by device pair.
What Benefits Does the BigQuery Data Lake Provide?
- Faster incident response – Detection, correlation, and root-cause summarization happen in one place, in one conversation, not across a chain of disconnected tools.
- Fewer false positives, fewer missed issues – Per-element statistical baselines replace blunt global thresholds, so alerts reflect what’s genuinely abnormal.
- Predictable cost and strong guardrails – A read-only MCP boundary with allow-listed tables, byte limits, and query timeouts keeps analytics safe and costs controlled.
- Scales with the network – Pre-computed baselines and BigQuery’s serverless engine keep performance steady as data volumes grow.
- Lower barrier to insight – Natural-language access means engineers and account teams alike can get answers without writing SQL or learning yet another tool.
Conclusion
In NCP R1.7.0, the BigQuery Data Lake example is based on the idea that the accumulated network data that you can query and analyze will become increasingly valuable. NCP integrates inventory, telemetry, topology, and probe-based performance data into a BigQuery dataset, and combines this with an AI agent to query the dataset within configurable bounds and based on pre-computed performance and business logic. NCP then provides operations teams with an opportunity to transition from responding to problems to managing network operations based on the available data.
The AI agent identifies, classifies, and rationalizes anomalous events and answers these in the normal business language of the operations teams. This is what makes data actionable for teams managing thousands of devices on multiple vendor and regional deployments.
Frequently Asked Questions
What is the BigQuery Data Lake use case in Network Copilot R1.7.0?
Network Copilot R1.7.0 introduces Google BigQuery as a unified data lake for large-scale network analytics, bringing together inventory, telemetry, topology, and probe-based performance data into a single dataset. This eliminates the need for operations teams to juggle five to ten separate monitoring tools.
How does Network Copilot allow users to query the BigQuery Data Lake?
Network Copilot uses an AI agent layer that converts natural language questions, such as "show me anomalies in my network," into SQL queries against the BigQuery dataset. Results can be returned as text, tables, or charts generated directly from the prompt.
How does Network Copilot detect anomalies without manual threshold tuning?
NCP builds statistical baselines from historical telemetry using day-of-week and hour-of-day patterns, then flags deviations automatically using 3-sigma statistical bounds and Z-score analysis. This replaces static global thresholds that often cause teams to miss meaningful alerts or get buried in false positives.
What data domains are included in the BigQuery Data Lake?
The data lake covers eight core entity tables spanning inventory, topology, telemetry, and performance and events. Every table references a common device registry key, allowing NCP to answer questions that span multiple domains in a single conversation.
How does Network Copilot keep query costs predictable?
A Model Context Protocol (MCP) server acts as a security and cost boundary between the AI agent and BigQuery, enforcing read-only operations, allow-listed tables, per-query byte limits, and query timeouts. This keeps analytics safe and costs controlled as data volumes grow.
What are pre-computed baselines and why do they matter?
NCP stores pre-calculated mean, standard deviation, and 3-sigma thresholds for each device-interface-circuit pair on an hourly, weekly, and monthly basis, rather than querying raw time-series data for every request. This approach keeps responses fast and consistent even across very large datasets.
What happens when Network Copilot detects an anomaly?
When an anomaly is detected, NCP runs an autonomous diagnostic playbook that correlates the deviation with topology, related metrics, and service impact. It then produces a structured root-cause analysis summary formatted for direct use in an issues ticket such as ServiceNow.
How do I connect Network Copilot to a BigQuery Data Lake?
You can connect through the BigQuery Data Connector in the Admin View by navigating to Data Connectors, selecting Add Connector, and choosing BigQuery. Only a connector name and a GCP service account key file in JSON format are required to get started.
Learn how Network Copilot and the BigQuery Data Connector help transform network telemetry into AI-driven operational intelligence. Explore the documentation, schedule a demo, or talk to our team to see how it works in your environment.


