




Aviz Network Copilot R2.0.0: One Copilot for Your Network and AI Infrastructure
Connected to your tools, verified at every step, and secured by evidence-based audits
 October 6, 2026
 Network Copilot ™
Release 2.0.0 takes Network Copilot beyond the network. Operators can now operate AI infrastructure by chat, connect the monitoring and ticketing tools they already use, see how every answer was produced, speak to Copilot in their own language, and audit device security with evidence for every verdict. Each feature below is described briefly; detailed how-to steps will follow in separate feature blogs.
| AI-NOC NVIDIA connectors |
25+ connectors Data Connectors |
Trust Trace, audit log, LLMs |
Voice 18 languages |
Security Audit 59 checks |
AI-NOC: Operate GPU Infrastructure Conversationally
NVIDIA connectors · Troubleshooting agent · Tenant operations · Prometheus · Token Savings
NVIDIA Connectors
Dynamo, DCGM, and BCM
Connectors for Nvidia Dynamo, DCGM, and BCM bring inference, GPU, and cluster data into the same chat as the network.
Troubleshooting and Tenant Operations
from a slow endpoint to a root cause
A troubleshooting agent finds the layer at fault and recommends an action, while Fabric & Tenant Operations run ONES-FM tasks by chat with confirmation before any change.
Prometheus
metrics in plain language
Ask for metrics in plain words and Copilot builds the query and the chart, with no PromQL needed.
Token Savings
lower LLM cost
Token Compression reduces the context sent to the model, and the Token Savings tab shows the savings for each LLM.
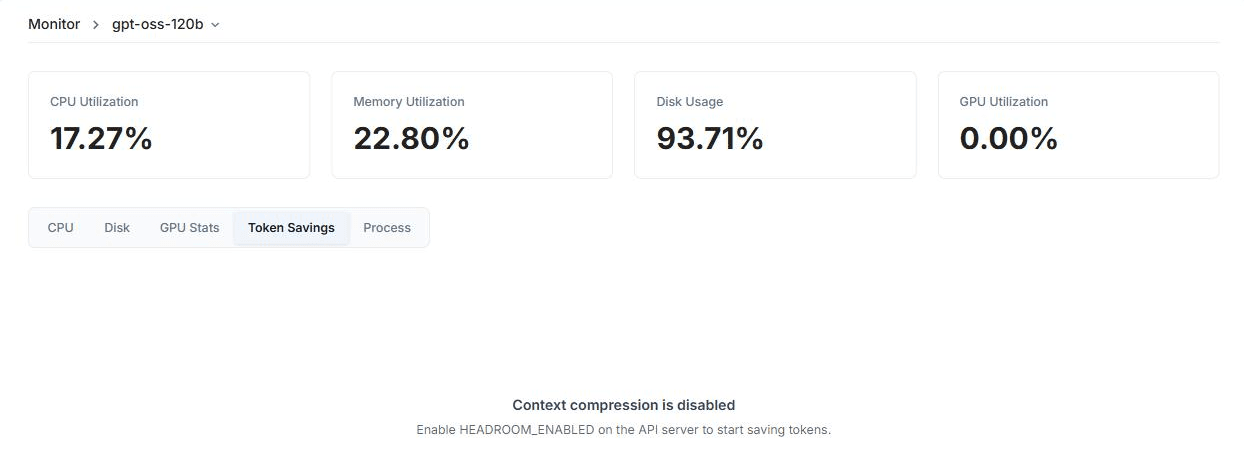
Monitor, Token Savings tab
Connector Reference: New and Extended in R2.0.0
API · Local MCP · MCP server
NCP supports 25+ data connectors in total, across network managers, cloud storage, data warehouses, monitoring, security, and ITSM. New in R2.0.0 (8): Prometheus, Zabbix, Syslog, Palo Alto Networks Firewall, DevRev, Nvidia DCGM, Nvidia Dynamo, and Nvidia BCM. Extended with MCP in R2.0.0 (3): Catalyst Center, Nexus Dashboard, and ONES. All other connectors were already supported and are unchanged.
| Connector | Category | Key inputs |
|---|---|---|
| Prometheus | Observability / Logging / Monitoring | URL; connection mode; auth (None, Bearer Token, Username & Password) |
| Zabbix | Observability / Logging / Monitoring | Zabbix URL; API Token; connection mode |
| Syslog | Observability / Logging / Monitoring | Host; Port (514); Protocol; Facility; Test, Save, then activate |
| Palo Alto Networks Firewall | Security / Firewall (Palo Alto Networks) | Firewall URI; authentication: Auth Token or Username & Password; connection mode: API or Local MCP server |
| DevRev | ITSM | MCP Server Endpoint; Personal Access Token |
| Nvidia DCGM | Compute & AI Orchestration | Prometheus endpoint exposing DCGM metrics |
| Nvidia Dynamo | Compute & AI Orchestration | Metrics source: vLLM /metrics URLs or Dynamo endpoint |
| Nvidia BCM | Compute & AI Orchestration | BCM Host; combined client certificate + key .pem |
| Catalyst Center (Local MCP) | Network Assurance / Orchestration | Catalyst URI; Auth Token or Username & Password; read-only Local MCP container |
| Nexus Dashboard (Local / Remote MCP) | Network Assurance / Orchestration | Nexus Dashboard URI; credentials; Local or Remote MCP tab |
| ONES (unified, Local MCP) | Network Assurance / Orchestration | One URL and login; ONES-T / ONES-FM auto-detected |
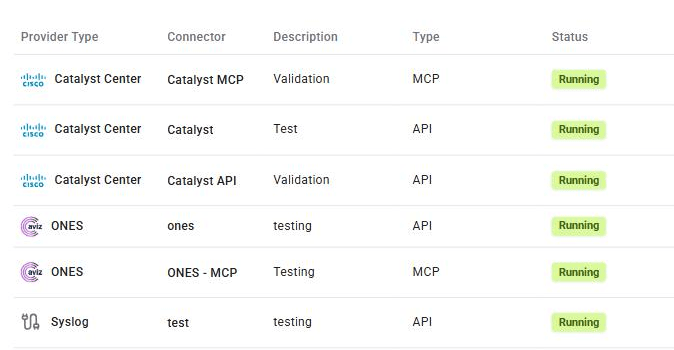
Data Connectors running in the product
NetOps Integrations: Bring Your Monitoring and ITSM Tools In
Catalyst · Nexus · Zabbix · Syslog · Palo Alto · DevRev · ONES MCP · DSX Air
Catalyst Center and Nexus Dashboard
read-only Local MCP connectors and agents
Read-only Local MCP connectors, plus a Zabbix agent, give chat access to inventory, device health, fabric summaries, and alerts.
Prometheus, Zabbix, and Syslog
monitoring in, audit events out
Prometheus and Zabbix make monitoring data queryable in chat, and Syslog forwards NCP audit events to your SIEM.
Palo Alto Networks Firewall and DevRev
security and ITSM
Chat access to firewall inventory, interfaces, and policies, and to DevRev tickets through its MCP server.
ONES MCP and DSX Air
telemetry for support, and a place to try NCP
An MCP server exposes ONES telemetry for support, and Network Copilot now runs on DSX Air for hardware-free trials.
Trust and Governance: See, Audit, and Control
Agent Trace · Activity Log · Audit Logging · LLM Management
Agent Trace & Sources
see how every answer was produced
See the agents, tools, and sources behind any response, with status and duration, so answers can be verified.
Activity Log and Audit Logging
a searchable evidence trail
Admins can search agent, LLM, and tool activity, export it as CSV, JSON, or NDJSON, and forward it to a SIEM.
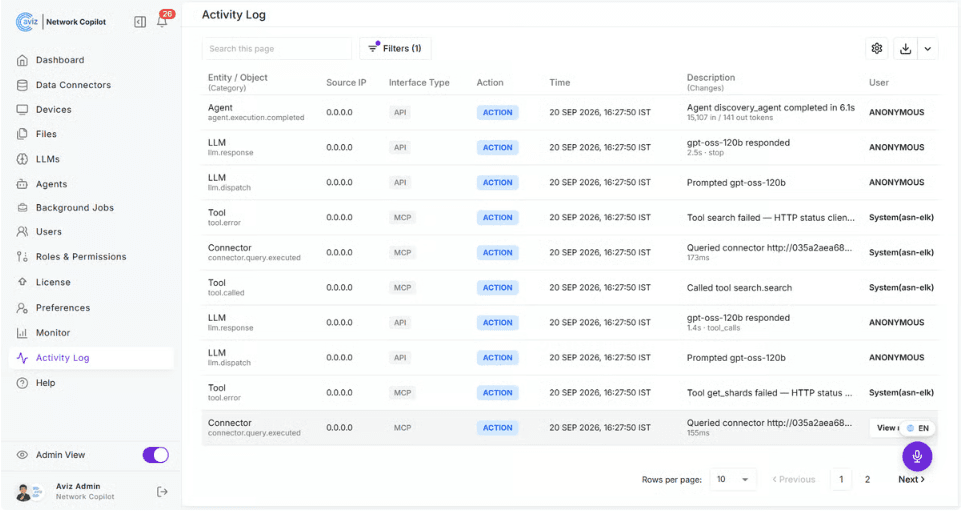
Activity Log with search, filters, and export
LLM Management
control over the models NCP uses
Set a default LLM, edit one, add one without authentication, and choose the reasoning effort.
Experience: Speak, Listen, and Work in Your Language
Voicebox · Accessibility · Multi-language · Visualizations
Voicebox
hands-free voice conversations
Say “hey copilot”, ask, and hear the answer in 18 languages, with speech processed in the browser.
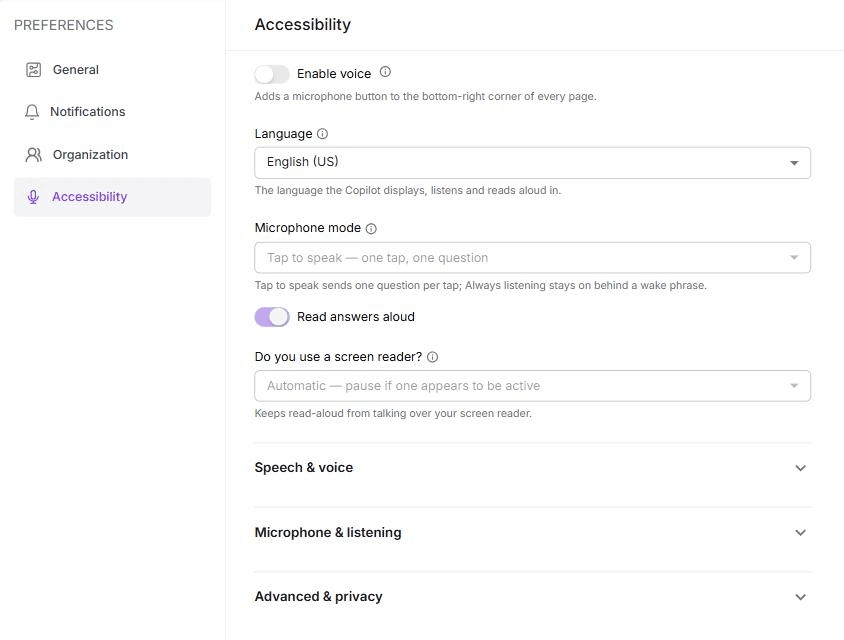
Accessibility settings: voice, language, and read-aloud
Multi-language Chat and Visualizations
your language, richer results
Chat in your language and see results as heatmaps, network graphs, and dashboards.
Platform, Support and Lifecycle
SDK, support model, and fixes
NCP SDK v1.4.0 adds agent memory, handoffs, and skills, the NCP Support Model adds a SONiC support assistant, and the release includes platform-wide fixes.
Security Audit: Evidence-Based, Customizable, Comparable
Custom template · Evidence · CSV / XLS · IOS-XE / IOS-XR · ONES FM · Cache comparison
Device configuration is checked against best practice and every finding maps to a NIST SP 800-53 control, so compliance is provable.
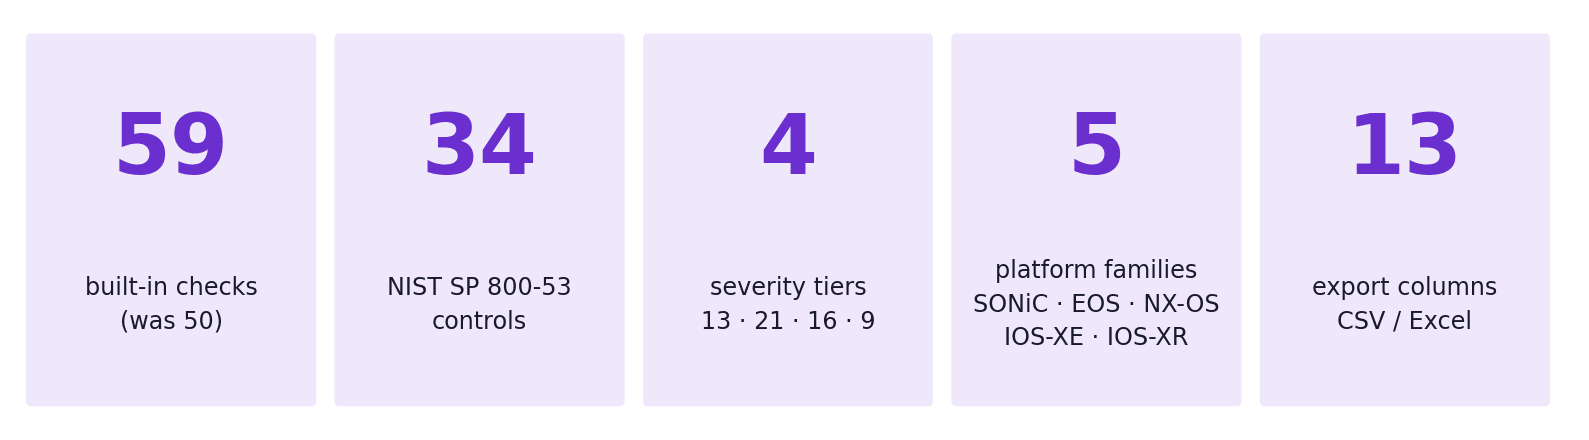
Security Audit catalog at a glance
New in R2.0.0: 59 checks with control IDs and rationale; your own checklist as a custom template; evidence behind every verdict; CSV and Excel export; Cisco IOS-XE and IOS-XR; SONiC through the ONES FM Controller; and comparison against the last saved report.
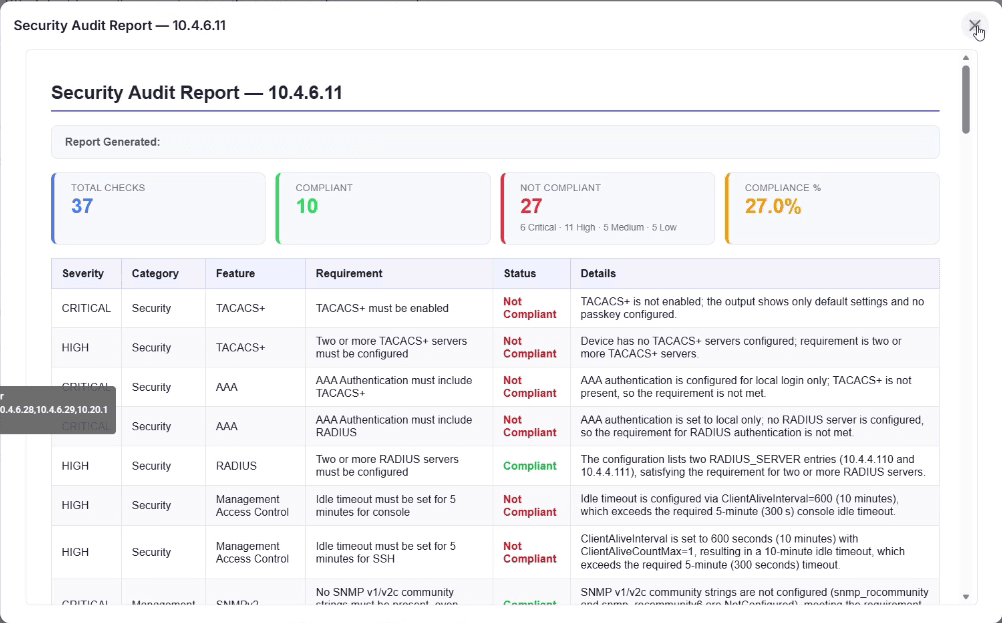
Fullscreen Security Audit report with severity, requirement, status, and evidence
| Why it matters: auditors get a control ID, a severity, evidence, and a trend against the last run without exporting to a spreadsheet first. |
Conclusion
R2.0.0 extends Network Copilot into GPU and AI infrastructure, plugs into the tools teams already run, and shows its work through Agent Trace, the Activity Log, and audit evidence.
Frequently Asked Questions
What is new in Aviz Network Copilot R2.0.0?
R2.0.0 extends Network Copilot beyond traditional networking to include GPU and AI infrastructure management, 25+ data connectors, voice interaction in 18 languages, trust and governance features, and an evidence-based security audit with 59 checks.
What NVIDIA integrations does R2.0.0 introduce?
R2.0.0 adds connectors for NVIDIA Dynamo, DCGM, and BCM, bringing inference, GPU, and cluster data into the same chat interface as the network.
How many data connectors does Network Copilot support in R2.0.0?
Network Copilot supports 25+ data connectors in total, with 8 new connectors added in R2.0.0 including Prometheus, Zabbix, Syslog, Palo Alto Networks Firewall, DevRev, and three NVIDIA connectors.
What is Agent Trace and why does it matter?
Agent Trace shows the agents, tools, and sources behind any response along with status and duration, so operators can verify how every answer was produced.
How does the Security Audit feature work in R2.0.0?
Device configurations are checked against best practices across 59 checks, with every finding mapped to a NIST SP 800-53 control and backed by evidence, and results can be exported to CSV or Excel.
What languages does Network Copilot support for voice and chat?
Network Copilot supports voice and chat interaction in 18 languages, with speech processed directly in the browser using the Voicebox feature.
Can Network Copilot forward audit activity to a SIEM?
Yes, the Activity Log allows admins to search agent, LLM, and tool activity, export it as CSV, JSON, or NDJSON, and forward it to a SIEM via Syslog.
Does R2.0.0 support Prometheus without requiring PromQL knowledge?
Yes, operators can ask for metrics in plain language and Network Copilot builds the query and chart automatically, with no PromQL required.


