





ASN Observability Using DPI Metadata for Compliance Ready Network and Application Intelligence
 February 5, 2026
 Deep Network Observability
Summary
ASN Observability extracts over 100 metadata fields from encrypted and unencrypted traffic to deliver deep application visibility without payload decryption. Aviz Service Node uses DPI-driven metadata to enable faster troubleshooting, stronger security insight, and compliance-ready intelligence across telco, datacenter, FTTH, and edge networks.
Introduction
Modern enterprise and service provider networks operate in an encryption-first environment, which protects data but limits visibility into application behavior. This makes troubleshooting, security analysis, and compliance validation more difficult.
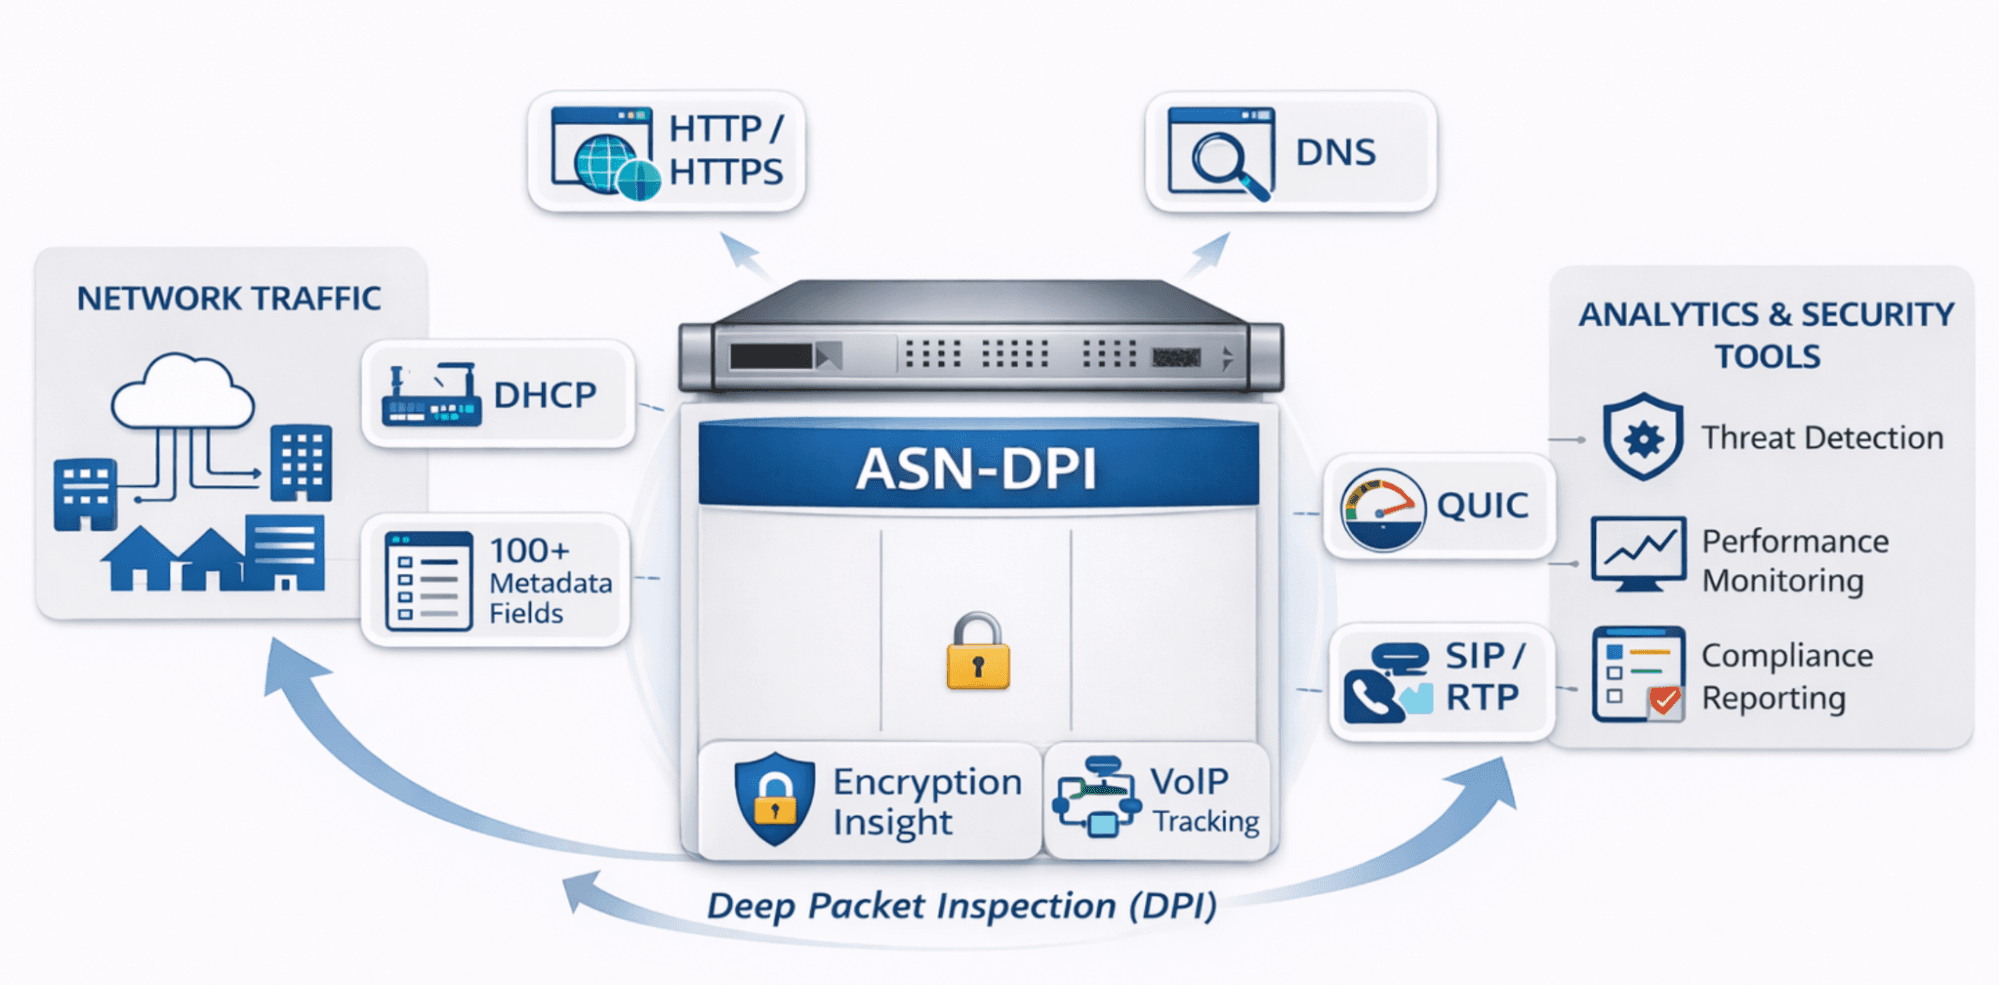
Aviz Service Node addresses this by extending Deep Packet Inspection into structured metadata extraction across protocols like HTTP, DNS, SSL TLS, QUIC, DHCP, and SIP RTP. By analyzing metadata instead of decrypting payloads, it preserves privacy while restoring application context and accelerating issue detection.
Deep Packet Inspection Metadata Architecture in Aviz Service Node
Aviz Service Node used DPI based metadata extraction to transform raw network traffic into actionable intelligence. The platform analyzed packets in real time and exported protocol specific metadata while respecting encryption boundaries.
Capabilities included
- Metadata extraction across HTTP, DNS, SSL TLS, QUIC, DHCP, and SIP RTP
- Visibility into application behavior without payload inspection
- Support for security, performance monitoring, and compliance analytics
- Real time metadata export to analytics and monitoring tools
Why Application Level Metadata Solves Modern Network Blind Spots
Traditional packet capture confirmed that traffic occurred but failed to explain application behavior. ASN Observability addressed three core challenges faced by modern networks.
Encryption Everywhere Reduced Visibility
Over 95 percent of internet traffic was encrypted, turning traditional monitoring into a black box. Operators could see tunnel endpoints and byte counts but not application actions, certificate behavior, or voice quality impairments.
Troubleshooting Delays Increased MTTR
When users reported slow or failing applications, teams spent hours correlating logs across multiple systems. Metadata driven observability allowed teams to quickly isolate whether issues stemmed from DNS latency, TLS negotiation failures, HTTP errors, or transport anomalies.
Compliance Required Structured Evidence
Regulatory frameworks required demonstrable proof of encryption standards, service access patterns, and client interactions. Metadata provided structured, queryable records without exposing payload data or violating privacy requirements.
Protocol Specific Metadata Extraction for Application Intelligence
Aviz Service Node extracted deep protocol level metadata using modular DPI handlers, enabling detailed visibility across multiple protocol families.
HTTP and HTTP2 Application Behavior Visibility
Extracted metadata included
- Hostnames, URL paths, and HTTP methods
- User agent strings and inferred client platforms
- Response status codes and content types
- Server software and custom headers
This enabled teams to quickly distinguish client side errors from backend failures and correlate issues with specific user agents.
DNS Name Resolution Intelligence
DNS metadata revealed
- Queried domain names and record types
- Response codes such as NXDOMAIN
- Returned IP addresses and TTL values
- Unusual query patterns and resolution failures
This helped detect DNS misconfigurations, failed resolutions, and anomalous behavior.
SSL TLS Metadata Without Payload Decryption
TLS handshake metadata provided
- Server Name Indication and certificate details
- TLS versions and cipher suites
- JA3 and JA4 client fingerprints
- Encryption posture indicators
This enabled identification of weak ciphers, deprecated TLS versions, and anomalous client behavior without decryption.
QUIC Transport Layer Visibility
For QUIC traffic, ASN extracted
- Connection identifiers and version negotiation
- Transport parameters and flow control limits
- Client fingerprinting adapted for QUIC
- Performance indicators such as ACK delays
This maintained visibility as applications migrated from TCP to QUIC.
SIP and RTP Voice and Video Quality Metrics
VoIP metadata included
- SIP call IDs for signaling and media correlation
- Codec types, sampling rates, and channel counts
- RTP packet loss, jitter, duplicates, and reordering
- Session classification and error detection
This enabled rapid identification of call quality issues before user escalation.
DHCP IP Assignment Correlation
DHCP metadata delivered
- Client MAC addresses and assigned IPs
- Lease durations and lifecycle events
- Session correlation back to physical devices
This completed end to end session visibility.
Modular and Event Driven DPI Architecture for Scale and Extensibility
Aviz Service Node adopted a modular, event driven DPI architecture rather than monolithic parsers.
Architectural benefits included
- Independent protocol handlers with event callbacks
- Protocol aware export logic
- Rapid onboarding of new protocols
- Long term scalability as application ecosystems evolved
This design ensured faster feature expansion and cleaner protocol extensibility.
Flexible Metadata Configuration with FlowVision
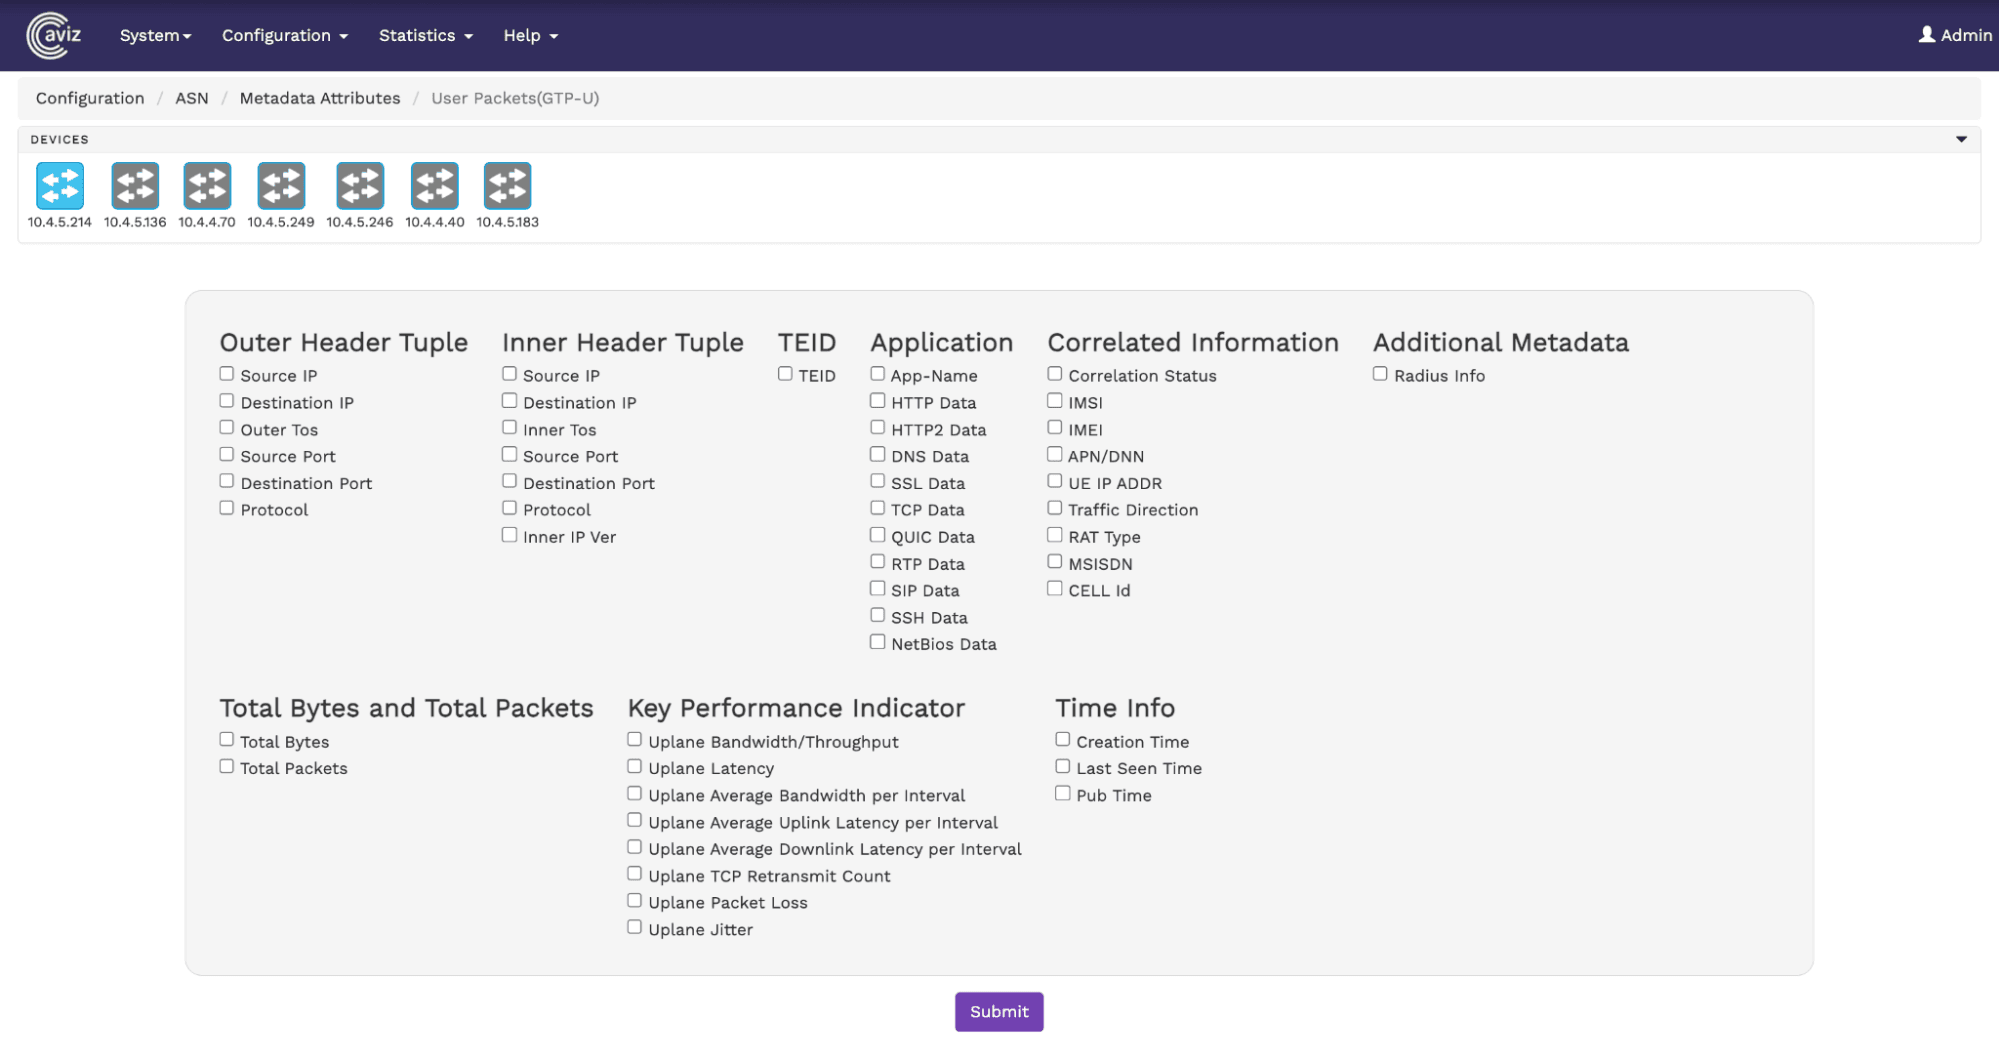
The platform supported selective metadata configuration through FlowVision.
Operational advantages included
- Exporting only relevant metadata fields
- Optimized storage consumption
- Reduced processing overhead
- Focused analytics aligned to operational, security, and compliance needs
Traditional Packet Capture Versus ASN DPI Metadata Observability
Traditional monitoring tools struggled to deliver meaningful application insight at scale.
Key differences included
- Encrypted traffic remained a black box in packet capture
- ASN DPI extracted over 100 metadata fields
- Troubleshooting required multiple tools versus a single pane of context
- Security detection shifted from signature based to behavioral analysis
- Compliance evidence moved from packet dumps to privacy safe metadata
| Capability | Traditional Packet Capture | Aviz Service Node DPI |
|---|---|---|
| Traffic visibility | Encrypted payloads = black box | 100+ metadata fields extracted |
| Troubleshooting | Correlate logs across 5+ systems | Single pane: network + application context |
| Security detection | Signature-based (malware only) | Behavioral (TLS fingerprints, DNS patterns) |
| Compliance evidence | Packet dumps (privacy concerns) | Metadata logs (no PII in payloads) |
| Protocol support | Manual parsing per new protocol | Modular handlers, rapid extensibility |
Conclusion
Deep application observability focuses on collecting smarter data, not more data. ASN Observability enables operators to quickly determine whether issues originate from DNS, TLS, HTTP, or media quality.
By extracting rich DPI metadata without payload decryption, Aviz Service Node delivers faster troubleshooting, stronger security visibility, and compliance-ready intelligence while preserving privacy.
Frequently Asked Questions
What are the two biggest things that changed in ONES 4.1?
Two things stand out. Telemetry Preferences lets operators control exactly which telemetry gets collected instead of pulling everything all the time. ONES Monitoring automatically tracks host-level health including CPU, memory, disk, and Docker container status without anyone setting it up manually. Both changes reduce overhead and give teams better visibility with less noise.
What was wrong with the always-on telemetry approach in earlier ONES versions?
Earlier versions subscribed to every available telemetry path from every device automatically. That sounds thorough but it created unnecessary data volume, added load on devices and collectors, and buried useful signals in noise. ONES 4.1 flips that by letting teams turn on only what they actually need for each device and use case.
What are the three telemetry preference categories in ONES 4.1?
Platform Default covers hardware and environmental basics like interfaces, fans, and power supplies and stays on by default. Feature Protocol covers ACL, BGP, VXLAN, VLAN, LACP, and route capacity and gets enabled only for features that are actually in use. QoS Telemetry covers traffic prioritisation, queue behaviour, and performance under load and can be switched on or off based on the device role and what the team is troubleshooting.
Which platforms does Telemetry Preferences support?
Telemetry Preferences works across SONiC, Cumulus, Cisco NX-OS, Arista, and Compute platforms. Teams running mixed-vendor environments get consistent telemetry control across the whole fleet rather than having to manage collection differently for each platform.
How did infrastructure health monitoring work before ONES Monitoring and what changed?
Before 4.1, checking server health meant doing it manually, inspecting Docker containers directly, and finding out about problems only after something broke. ONES Monitoring in 4.1 handles all of that automatically. CPU, memory, disk, and container metrics publish into the existing telemetry pipeline so the data is already there before anyone files a ticket.
What does ONES 4.1 set up for proactive alerting going forward?
The rule engine integration in 4.1 lets teams define CPU, memory, and disk utilisation thresholds. When a threshold gets breached, an alert fires automatically. The idea is catching issues early enough to act before they turn into outages rather than discovering problems after users start complaining or services go down.
Why does collecting less telemetry actually improve network observability?
Pulling every metric from every device all the time adds load to both the devices and the collector and buries the signals teams actually care about. When operators turn on only the telemetry relevant to each device's role and active features, the data that comes back is cleaner and easier to act on. Less volume with better targeting beats more volume with no filter every time.
How does publishing monitoring metrics into the existing telemetry pipeline help operations teams?
Host and container health data lands in the same place as network telemetry rather than sitting in a separate system. Teams checking on network performance and teams checking on infrastructure health look at the same pipeline. No switching between tools, no correlating data from two different sources manually, and no gap between when a problem starts and when someone sees it.
Discover how Aviz Service Nodes transform DPI metadata into compliance ready network and application intelligence without payload decryption.


