





Aviz AI-Parser: Every LLM Call, Metered Straight from the Network
 November 11, 2026
 AI Factory
An AI factory's product is tokens
Every AI factory produces tokens. A NeoCloud sells them to tenants; sovereign programs and enterprises deliver them to their own departments, teams and applications. Aviz AI-Parser shows who is consuming them, how many, and what experience they get, metered straight from the network with zero added latency and nothing to instrument.
That question now applies to three kinds of builders:
- NeoClouds selling GPU capacity to many tenants. They need visibility per tenant, and inside each tenant, across the different inference engines and LLMs that tenant's applications use, so they can bill, prove SLAs and grow revenue per GPU.
- Sovereign AI programs and regulated organizations, such as governments, healthcare systems and banks, bringing AI inside environments they control for data sovereignty, privacy, security and governance.
- Enterprises building their own AI factories to serve internal teams and applications on open models such as Qwen, DeepSeek and Llama, on-premises, in sovereign clouds or fully air-gapped.
All three share one shift. Once you move from consuming AI as a service to providing it, you take on what an AI cloud provider normally handles behind the scenes, including knowing how the service is being consumed.
When you provide AI, visibility becomes your job
Most teams building on AI don't start by building a sovereign factory. They start by building an application against a commercial API, such as Claude, OpenAI or another hosted model. That choice quietly hands them observability they never had to build: every call already comes back with a token count, a model identity and a latency the provider measured for them. It's part of the product.
Once that same application moves to a self-hosted open or open-weight model, such as Qwen, DeepSeek or Llama, on-premises or fully air-gapped, the need for that observability doesn't go away. But a self-hosted engine like vLLM reports usage in aggregate, labeled only by the model: no per-tenant identity, no prompt content, and no independent per-call record of the tokens each tenant consumed. What a commercial API handed over for free, a self-hosted stack has no obligation to give back.
Whoever now provides the AI service has to supply that visibility themselves: a NeoCloud to its tenants, a sovereign program to its agencies, or an enterprise to its own teams and applications. That means seeing what is happening at the inference and application layer, per tenant and per application, the kind of detail a commercial API or a dedicated AI observability vendor would otherwise provide. GPU, server and network metrics can show that the factory is busy. They cannot show who is consuming it, which models are involved, how many tokens are processed or what experience users get.
Inference engines such as vLLM, TensorRT-LLM, TGI, SGLang and NVIDIA Dynamo report valuable data about how they run: queues, batching and GPU work. AI-Parser does not replace that. It adds what the engines cannot see on their own: which tenant and application made each call, what they received and how long they actually waited. It measures this consistently across every engine, and independently of them.
How AI-Parser works: four steps, off the wire
AI-Parser is a passive meter built into the network, not a proxy. A SPAN tap mirrors the traffic between your applications and inference engines, and AI-Parser works on that copy in four steps:
- Capture. It rebuilds each LLM call, the request and the streamed response, from the mirrored traffic.
- Decrypt. A lightweight agent takes the session key from the inference engine, so encrypted calls can be read without an inline proxy.
- Meter and attribute. It records tokens, latency, model and application for every call.
- Stream out. It streams each record into the tools you already run: Elastic, Splunk, Prometheus or Grafana.
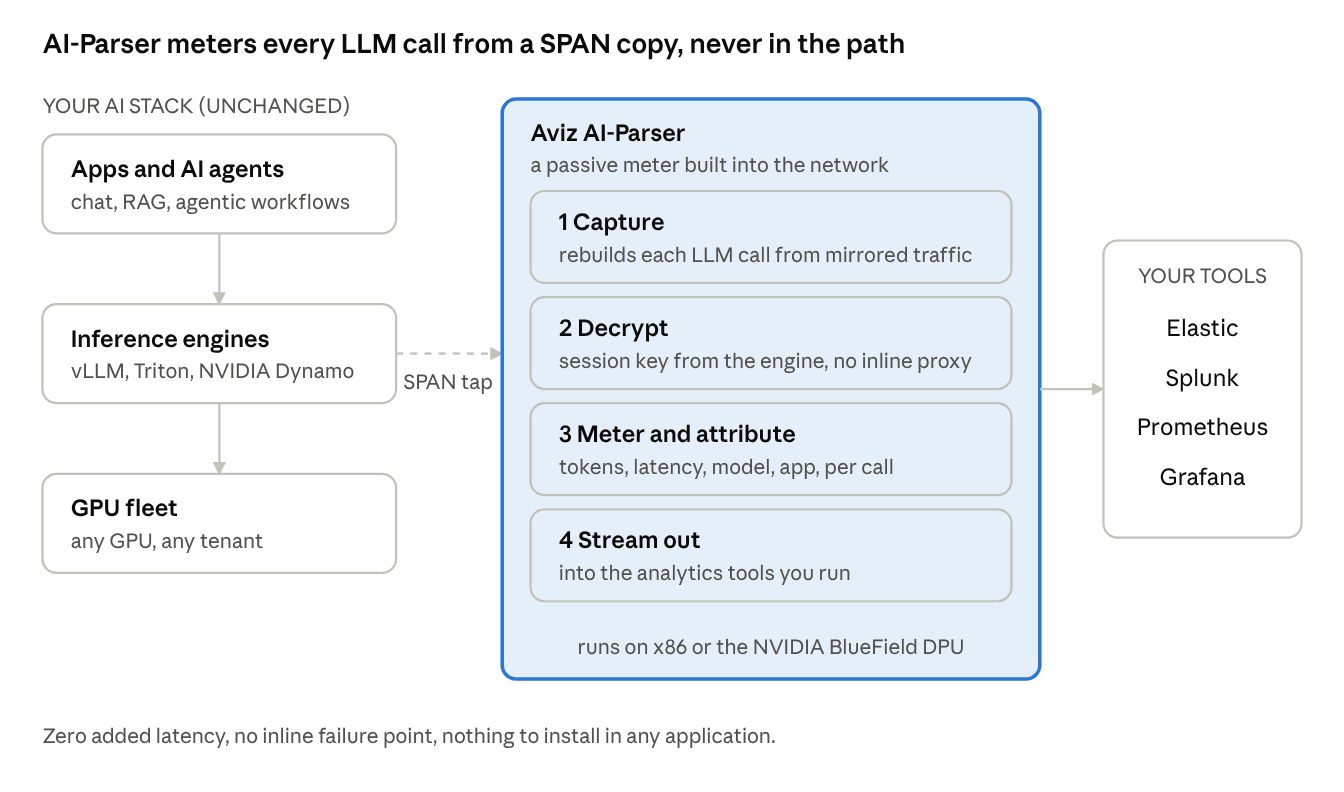
How AI-Parser works · a passive meter beside the live path
Nothing sits in the live path, so there is no added latency and no new point of failure. AI-Parser runs on x86 or on the NVIDIA BlueField DPU in front of the GPU server, with zero footprint on the host and nothing an application can bypass.
What you see: every call, every tenant
Each LLM call becomes one record, attributed to the tenant and application that made it. Here is what a few records look like (illustrative data):
| Tenant | App | Model | Input tokens | Output tokens | TTFT |
|---|---|---|---|---|---|
| tenant-a | claims-ai | mistral-large | 1,436 | 791 | 415 ms |
| tenant-b | code-agent | nemotron-70b | 2,200 | 731 | 111 ms |
| tenant-b | sql-copilot | llama-3.3-70b | 1,467 | 107 | 448 ms |
| tenant-c | rag-search | qwen2.5-72b | 1,376 | 962 | 202 ms |
| tenant-c | doc-summary | nemotron-70b | 2,874 | 315 | 108 ms |
Roll the records up by tenant and you have chargeback: tokens per tenant, per application and per model, measured rather than estimated.
Visibility doesn't stop at the tenant boundary. Inside a single tenant, the same records break down by application, inference engine and LLM. In the sample above, tenant-b runs code-agent on nemotron-70b and sql-copilot on llama-3.3-70b, and each is metered on its own.
Behind each record, AI-Parser answers five questions:
| Question | What AI-Parser records |
|---|---|
| Who | The calling application, by network identity, application header or hashed API key |
| What | Model invoked, prompt size and prompt fingerprint (full text when enabled), streaming or batch, agentic tool-call activity |
| How much | Input, output and total tokens, read from the server's own usage report, never estimated |
| How fast | Time-to-first-token (TTFT), end-to-end latency, inter-token latency, tokens per second, as the client experienced them |
| How healthy | Completed versus aborted calls, wasted tokens, truncated responses |
Model engines remain the best source for GPU internals. AI-Parser adds what only the wire can see: who asked, what they actually received, and how long they waited for it.
Prompt visibility: governance, DLP and more
AI-Parser sees the prompt as well as the tokens. That turns it from a meter into a governance tool, with privacy built in: by default it records a fingerprint of each prompt, and captures the full prompt text only when you explicitly enable it.
| Use case | How prompt visibility helps |
|---|---|
| Data loss prevention | Spot sensitive data being sent to models, such as customer records, source code or regulated information, with full-text capture enabled |
| Governance and audit | Keep an independent record of who sent what to which model, for compliance reviews and investigations |
| Deduplication | Fingerprints reveal repeated prompts across users and apps, pointing to caching and cost savings |
| Prompt analysis | Understand how each application actually uses its models, to tune prompts, models and capacity |
Fingerprints let teams find repeats and patterns without storing what people typed. Full-text capture is a deliberate choice for environments where policy requires it, and the records stay in the tools you control.
What it means for each kind of AI factory
The same per-call records answer a different question for each builder.
| Who | The question they need answered | What AI-Parser gives them |
|---|---|---|
| NeoClouds | Which tenant used what, and did they get the service they paid for? | Per-tenant token chargeback and TTFT, plus a breakdown inside each tenant by application, inference engine and LLM, so billing, SLA disputes and tenant support become a data lookup |
| Sovereign AI and regulated organizations | Who is using the AI service, for what, and can we prove it? | Tenant, application, IP or API-key attribution for every call, plus prompt signals for governance and DLP, recorded inside the controlled environment and streamed to your own tools |
| Enterprise AI factories | Which teams and applications drive GPU demand? | Showback per team, app and model, plus the usage trends needed for capacity planning |
For architects, the payoff is efficiency. A GPU metric may say the factory is 90% busy. Inference metadata adds which model, tenant and application are driving that load, and how much is lost to aborted generations.
For sovereign and air-gapped deployments, nothing has to leave the estate. AI-Parser runs on infrastructure you control, and its records go only to the analytics, security and governance tools you already run.
Where AI-Parser fits in the operational AI factory
Owning GPUs and models does not automatically give you an AI cloud experience. Aviz covers the operational layers around them:
- Aviz ONES and Aviz Service Gateway make the network and tenant services operational and multi-tenant.
- Aviz AI-Parser shows how the AI service is being consumed.
- Aviz AI-NOC correlates network, GPU, workload and inference telemetry, including AI-Parser's records, to find root cause across the factory.
The goal is not to replace the GPU stack, the inference stack or the workload platform. It is to make them easier to operate together.
The takeaway
Whether you run a NeoCloud, a sovereign AI program or your own enterprise AI factory, providing AI means knowing how it is consumed. AI-Parser delivers per-app tokens, TTFT on the wire and chargeback-ready records, with zero added latency and nothing to instrument.
Choose your models. Control your data. Own your infrastructure. Operate AI on your terms.
See it on your traffic. Reach out to Aviz Networks at aviznetworks.com to schedule a demo.
FAQs
How do I track token usage per tenant on a self-hosted LLM?
AI-Parser reads each OpenAI-compatible call from mirrored network traffic and records input, output and total tokens per call. Each record is attributed to the tenant and application that made it.
Does AI-Parser add latency to inference?
No. It is a passive tap on a copy of the traffic, not a proxy, so it never sits in the request path.
Do I need to change my applications or inference engines?
No. Nothing is installed in any application. AI-Parser runs on x86 or on the NVIDIA BlueField DPU, and a lightweight agent takes the session key from the inference engine so encrypted calls can be read without an inline proxy.
How is TTFT measured?
On the wire, from the first request byte to the first response token the client receives, so it reflects the experience the tenant actually gets.
Does AI-Parser capture prompts?
Yes, with privacy built in. By default it records a fingerprint of each prompt. Full prompt text is captured only when you explicitly enable it, for use cases such as data loss prevention and audit.
Can AI-Parser help detect data exfiltration through LLMs?
With full-text prompt capture enabled, prompt records can be inspected for sensitive data sent to models, and fed into the DLP and security tools you already run.
Are token counts estimated?
No. Counts are read from the inference server's own usage report in each response.
Where does the data go?
Records stream into the analytics tools you already run, such as Elastic, Splunk, Prometheus or Grafana.
Which inference engines does it work with?
Any engine that serves OpenAI-compatible APIs, including vLLM, TensorRT-LLM, TGI, SGLang and NVIDIA Dynamo.
Can AI-Parser run in a sovereign or air-gapped environment?
Yes. It runs on infrastructure you control, and its records stream only to the tools you choose, so usage data stays inside your operational and governance boundary.
Does AI-Parser replace my inference engine's metrics?
No. Engines remain the best source for serving and GPU internals. AI-Parser adds the tenant, application and client-experience view that only the network sees.
See AI-Parser meter every LLM call on your own traffic.


