





How Do You Meter AI Factory Tokens per Application on the Wire?
How the ASN AI Correlator turns inference traffic into per-application token, latency, and health insights
 November 19, 2026
 AI Factory
TL;DR
A GPU server often hosts inference for several applications, but inference engines report only aggregates, so the operator has no per-application data to bill, guarantee responsiveness or resize allocations. The ASN AI Correlator reads OpenAI-compatible inference traffic passively from mirrored traffic and emits one record per call: who asked, which model answered, how many tokens were used, how fast the answer arrived, and whether it completed. It decrypts TLS out of band without a proxy, grades the capture quality of every record, and needs no application changes. ASN runs on the NVIDIA BlueField-3 DPU or as a container on the GPU host, with identical records in both.
Introduction
In a GPU cloud or enterprise inference platform, one GPU server typically hosts inference services for several applications: a support chatbot, a coding assistant, a batch summarization job. The operator must bill each application for its usage, guarantee its responsiveness, and resize its allocation over time. Yet the operator has no per-application data to do so. Inference engines report only aggregates such as queue depth and total tokens; they cannot tell which application sent a request or whether it completed. Applications rarely instrument their code for the operator.
The solution. The ASN AI Correlator measures each application from the network. Every inference call is an OpenAI-compatible HTTP exchange carrying the model, the request parameters, the server's token count, and the timing of each streamed chunk. The correlator reads this exchange passively from mirrored traffic and emits one record per call: who asked, which model answered, how many tokens were used, how fast the answer arrived, and whether it completed. No application changes, no added latency.
This post covers how the correlator reconstructs calls from packets, decodes encrypted traffic, reports its own measurement accuracy, and deploys.
Why is the network the right place to meter AI inference?
An inference engine sees its own internals: its queue, its batches, its GPU memory. What it cannot see is the business around it. It does not know who the caller was, what that caller is paying for, or when the caller gave up and disconnected. Those facts exist only on the connection between the application and the engine.
The network also has a practical advantage. The OpenAI-compatible API has become the common interface across inference stacks, so a meter that understands that exchange works with any engine behind it, including endpoints nobody remembered to register.
| Engine dashboards | ASN AI Correlator | |
|---|---|---|
| Per-application attribution | Aggregates only | Every call |
| Latency | Inside the engine only | As seen on the network, including proxies and queueing |
| Token counts | Self-reported totals | Per call, independently observed |
| Abandoned requests | Typically invisible | Detected from the connection |
How does the ASN AI Correlator work?
The correlator observes a copy of the traffic and never sits in the request path. For each connection, it rebuilds the conversation between application and inference server, decrypts it if needed, and reads both sides of each call.
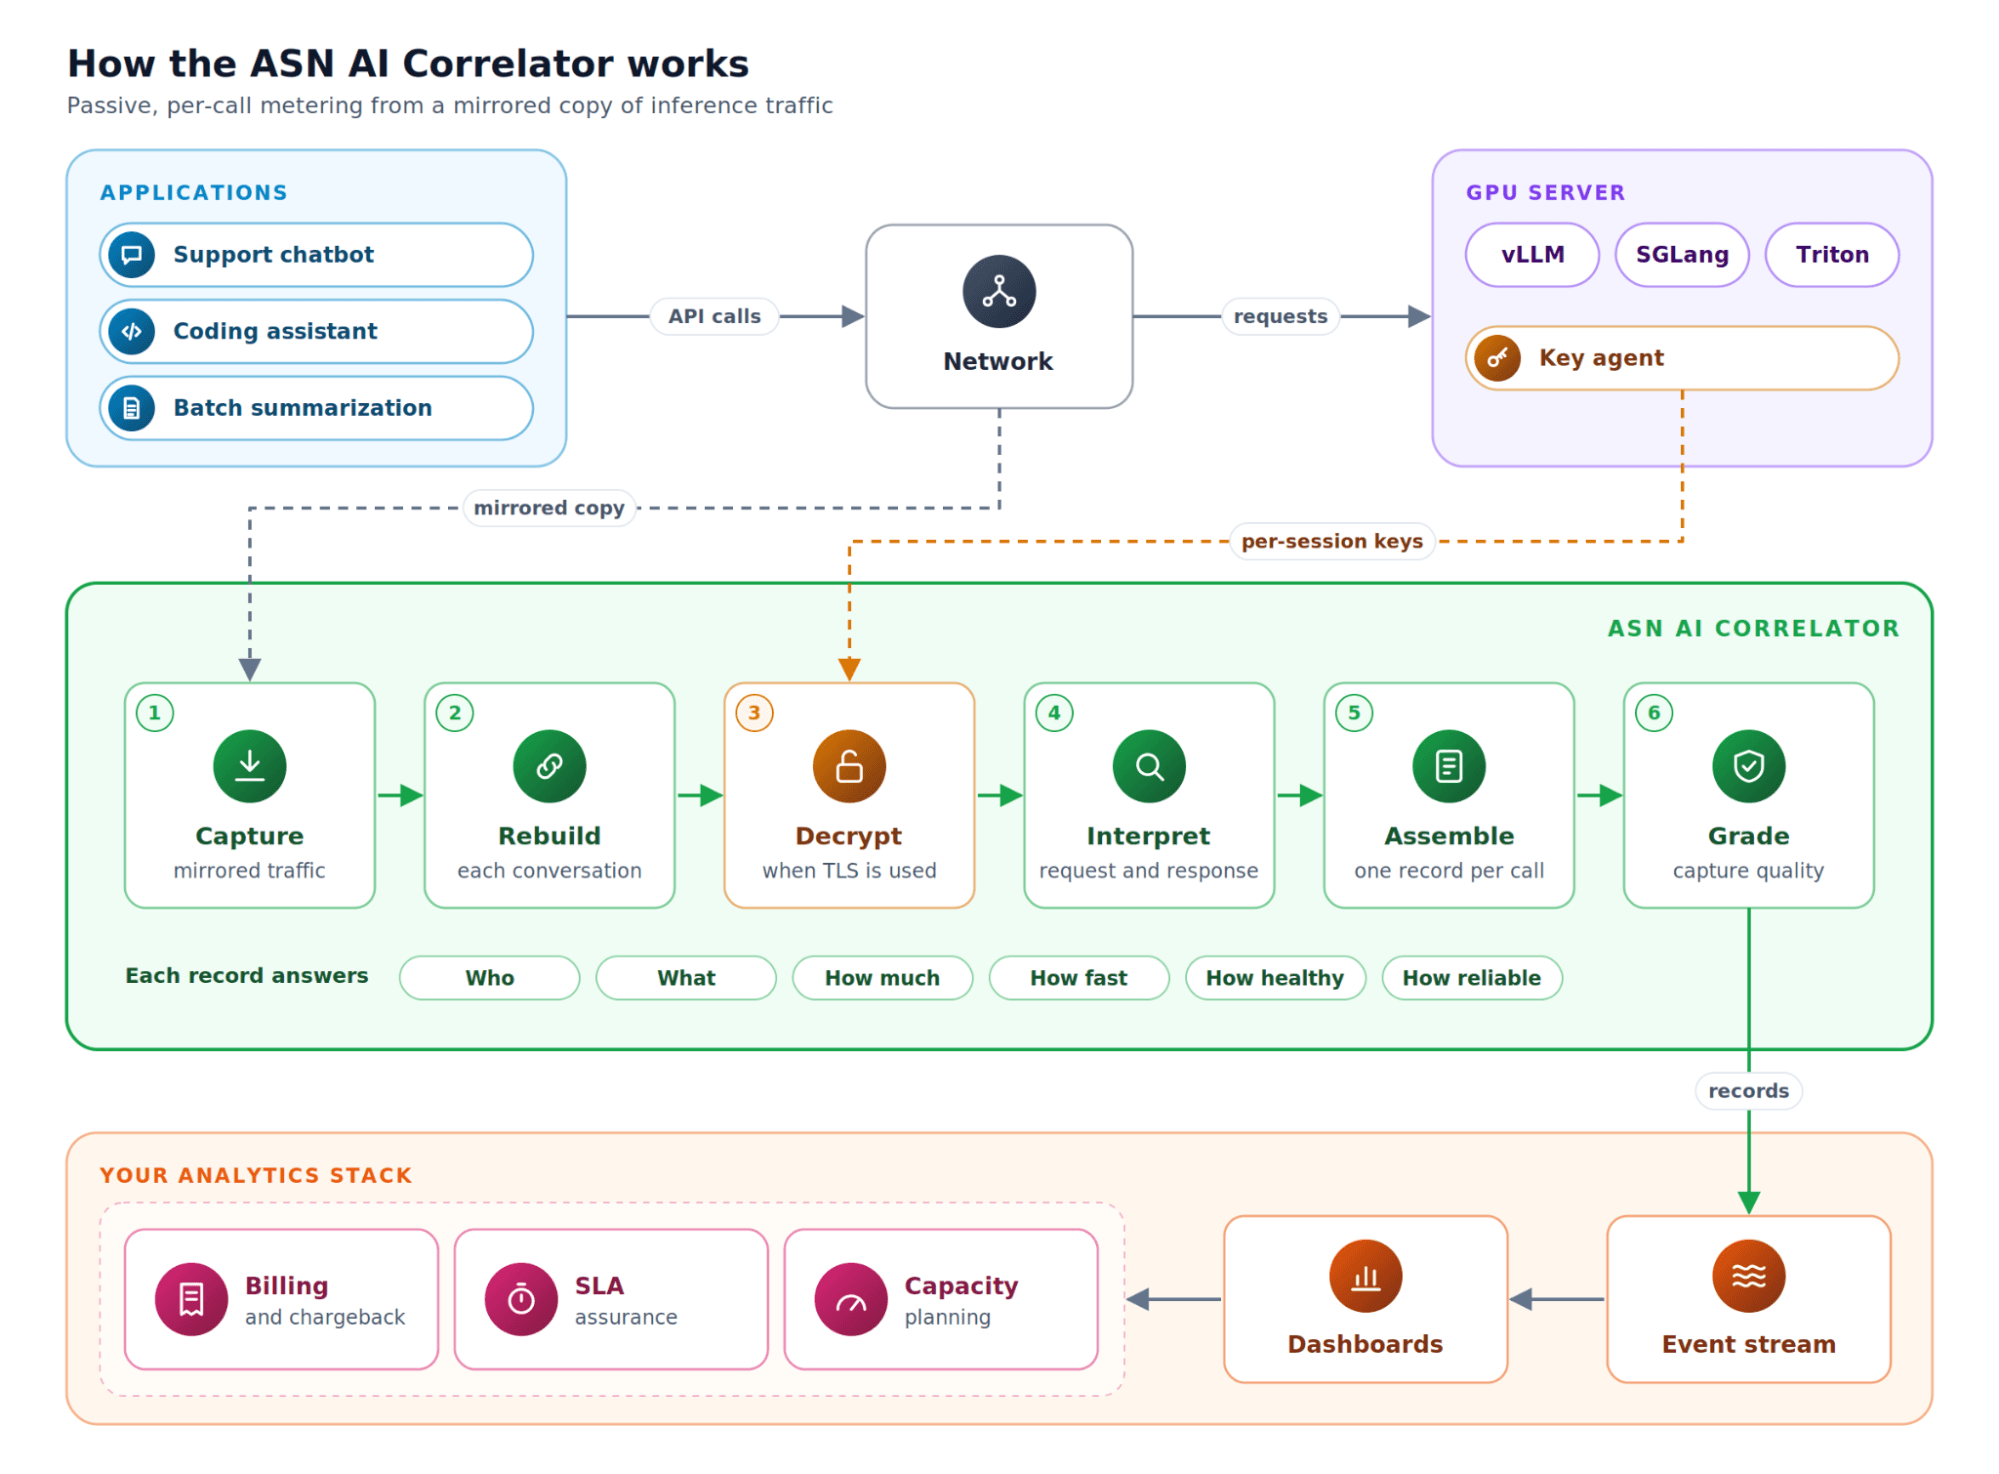
From the request, it learns which model was called, how large the conversation was, how much output the application asked for, whether the answer should be streamed, and whether the application is running an agentic workflow with tools.
From the response, it learns how many tokens the server actually consumed and produced, how the answer was delivered over time, and how it ended: completed, truncated, failed, or abandoned.
Two principles hold throughout.
Tokens are read first, estimated only as a fallback. Whenever the server includes its usage report, the token counts come straight from it, the same number any usage-based bill would be based on. Some clients, notably streaming clients that do not opt in, receive no usage report at all. For those calls the correlator estimates the counts from what it observed on the wire and marks the record as estimated, so measured and estimated values are never mixed.
Timing comes from the packets. Time to first token, end-to-end latency, inter-token latency, and output throughput are computed from when each part of the exchange actually crossed the network. These are the standard metrics the LLM serving community uses to describe user experience.
What can the network see that inference engines cannot?
Some of the most valuable signals are invisible from inside the engine:
- Abandoned requests. When a client disconnects mid-answer, the engine often keeps generating. The correlator sees the connection close before the answer finished and records the work as wasted.
- Truncated answers. Responses that were cut off because they hit their output limit are flagged.
- Over-reserved budgets. Applications that routinely request far more output capacity than they use are identified, a direct input to capacity planning.
- Load context. Each call records how busy the server was when it arrived, so a slow response can be read as queueing or as contention.
How does the correlator report its own measurement accuracy?
A passive meter is only trustworthy if it can say when it has not seen everything. Packet loss on the capture path, or a connection the correlator joined partway through, can leave a call incompletely observed. Every record therefore carries a capture quality verdict: complete, structurally incomplete, or affected by loss on the wire. Billing and SLA reports can be restricted to fully observed calls, and the share of incomplete ones becomes a health metric for the monitoring path itself. The meter reports on its own fidelity instead of asking to be trusted.
How does the correlator read encrypted inference traffic without a proxy?
Production inference is increasingly served over HTTPS. Terminating TLS with a proxy would defeat the purpose: it adds latency, creates an inline point of failure, and requires custody of server certificates. The correlator decrypts out of band instead. A lightweight agent on the server shares only per-session keys with ASN over a secured channel, and ASN decrypts its own mirrored copy of the traffic. The live connection is never touched, certificates never leave the server, and if keys are unavailable, the traffic simply passes unobserved.
What does each application get from the ASN AI Correlator?
Because each application reaches its inference service at its own network identity, and the orchestration layer already maps applications to IPs and GPUs, every call attaches to the right application automatically. No tagging, no agents in the application, no per-tenant onboarding.
| Question | Answer per application |
|---|---|
| Who | Which application made the call, and against which inference endpoint |
| What | Model, request rate, prompt size, streaming or batch, agentic activity |
| How much | Input, output, and total tokens from the server's own report |
| How fast | Time to first token, end-to-end latency, inter-token latency, throughput |
| How healthy | Completed, truncated, failed, and abandoned calls, plus wasted generation |
| How reliable | Capture quality on every record |
Records stream into the analytics stack the operator already runs, such as Kafka, Elasticsearch, and Kibana. Fleet views like percentiles, error rates, goodput, and cost per application are built on top as ordinary aggregations.
Private by default. Prompt text is not exported unless the operator explicitly enables it, and credentials are never exported in clear. Operators choose which categories of data leave the appliance.
See how Aviz Service Nodes meter inference traffic per application: explore Aviz Service Nodes.
How do you deploy the ASN AI Correlator?
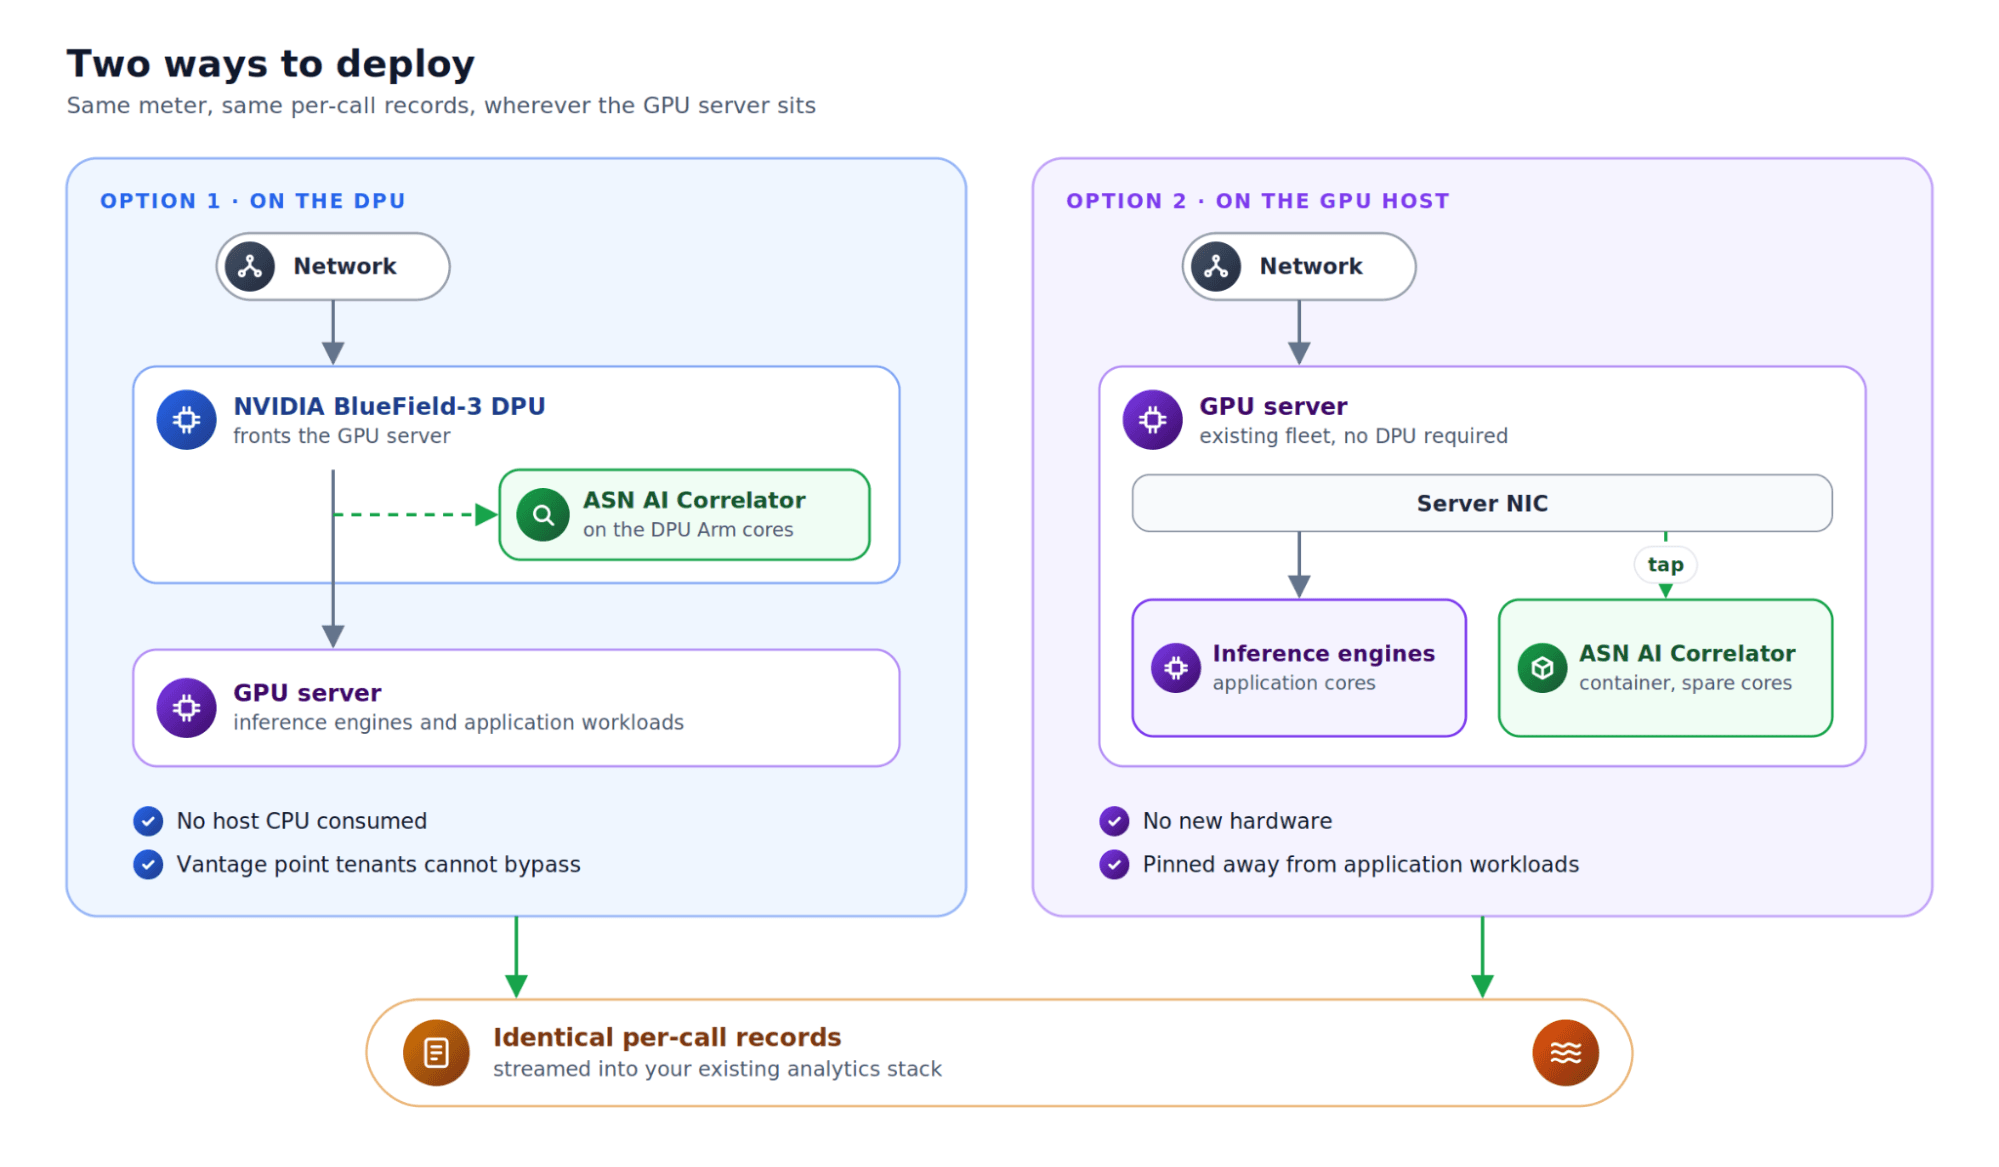
On the DPU. ASN runs on the NVIDIA BlueField-3 DPU that fronts the GPU server and sees all traffic before it reaches any application. It consumes no host CPU, and its vantage point cannot be bypassed or altered by tenants, which makes it the right foundation for billing and SLA evidence.
On the GPU host. For fleets without DPUs, ASN runs as a container on the GPU server, tapping traffic at the NIC on cores that application workloads do not use. It is the fastest path to value on existing infrastructure, and it is running today on a multi-application vLLM host, feeding per-application dashboards end to end.
The records are identical in both models.
Are the correlator's metrics grounded in LLM serving research?
The metrics the correlator reports are the ones the research community already uses to reason about LLM serving. Time to first token and inter-token latency are the core latency measures defined in NVIDIA's benchmarking guidance. DistServe and Splitwise show why prefill and decode must be measured separately, and DistServe's notion of goodput is built directly on these per-call latencies. Andes and Etalon argue that user experience in streaming services depends on how the answer arrives, not just how fast it starts, and that abandoned streams deliver no value. BurstGPT characterizes real workloads along the same dimensions the correlator captures, and the OpenTelemetry GenAI conventions provide a shared vocabulary for them.
What does per-application token metering change for the operator?
- Usage-based revenue. Token consumption per application and per model makes real chargeback possible, instead of flat-rating capacity.
- Provable SLAs. Responsiveness measured independently of the engine turns disputes into a data lookup.
- Reclaimed capacity. Abandoned generation, over-reserved budgets, and truncated answers become concrete right-sizing decisions.
- A neutral referee. The network's count is the one number neither operator nor tenant controls.
- A complete inventory. Every model endpoint carrying traffic is visible, including deployments nobody registered.
Conclusion
Inference engines see their own internals. Only the network sees the business. The ASN AI Correlator puts a meter where the tokens actually flow.
FAQ
What is the ASN AI Correlator?
The ASN AI Correlator is a passive network meter for inference traffic. The correlator reads mirrored OpenAI-compatible HTTP exchanges and emits one record per call. Each record shows who asked, which model answered, how many tokens were used, how fast the answer arrived, and whether the call completed.
Why measure from the network instead of from the inference engine?
Engines see their own internals, such as the queue, batches, and GPU memory. Engines cannot see who the caller was, what the caller pays for, or when the caller disconnected. Those facts exist only on the connection between the application and the engine. The OpenAI-compatible API is common across inference stacks, so the meter works with any engine behind the connection, including unregistered endpoints.
Does the correlator add latency or require application changes?
No. The correlator observes a copy of the traffic and never sits in the request path. Each call attaches to the right application through the application's network identity and the orchestration layer's existing IP and GPU mappings. No tagging, application agents, or per-tenant onboarding is needed.
Are token counts measured or estimated?
Tokens are read first and estimated only as a fallback. When the server includes a usage report, the counts come straight from the report. Some streaming clients receive no usage report. For such calls, the correlator estimates the counts from what was observed on the wire and marks the record as estimated. Measured and estimated values are never mixed.
What can the correlator detect that engine dashboards cannot?
- Abandoned requests: the client disconnects mid-answer while the engine keeps generating, so the work is recorded as wasted.
- Truncated answers: responses cut off at the output limit are flagged.
- Over-reserved budgets: applications that request far more output capacity than needed are identified.
- Load context: each call records how busy the server was on arrival, so a slow response reads as queueing or contention.
How does the correlator handle encrypted HTTPS traffic?
The correlator decrypts out of band, without a proxy. A lightweight agent on the server shares only per-session keys with ASN over a secured channel. ASN decrypts a mirrored copy of the traffic. The live connection is never touched, and certificates never leave the server. If keys are unavailable, the traffic passes unobserved.
How can the correlator be deployed?
There are two ways, and the records are identical in both:
- On the NVIDIA BlueField-3 DPU: ASN sees all traffic before the traffic reaches any application and uses no host CPU. Tenants cannot bypass or alter the DPU vantage point, which suits billing and SLA evidence.
- On the GPU host: ASN runs as a container and taps traffic at the NIC on cores that application workloads do not use. This option suits fleets without DPUs, and the container is running today on a multi-application vLLM host.


