Exciting Announcement! In celebration of launching our AI Certification, we’re thrilled to offer a 50% discount exclusively. Seize this unique chance—don’t let it slip by!

Categories
Aviz Service Nodes Network Observability

The KPI Advantage: Unlocking Network Observability Through Data

Introduction

In today’s digital era, network efficiency plays a pivotal role in determining the quality of communication and data exchange. Whether for data centers, service providers, or end-users, understanding key network Key Performance Indicators(KPI) like latency and bandwidth is crucial. These KPIs directly influence application performance, video streaming quality, online gaming, and cloud-based services. The ability to measure and optimize these parameters ensures a seamless user experience and improved network reliability. Lets discuss in detail on how Aviz Service Node (ASN) efficiently computes the different KPIs of any Network (Telco, DC, Edge, FTTH, Campus) and helps in achieving the refined Network Observability in this blog.

Supported KPIs

KPI Calculation

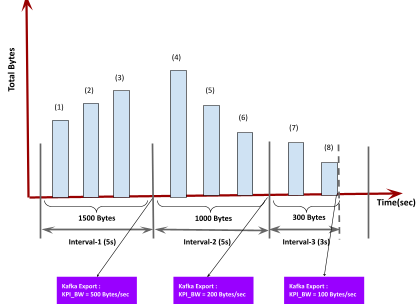
ASN calculates average bandwidth and latency at 5-second intervals and exports the KPI data to a Kafka topic. Additionally, when a session is closed before the completion of the 5-second interval, the system triggers an export to a priority Kafka topic. This ensures real-time observability and accurate metric reporting.
This guarantees that critical network metrics are available in real time, allowing for improved monitoring, anomaly detection, and performance optimization.

KPIs Supported Matrix

KPIS Per Session Per Application Per Region
Throughput/Bandwidth
Uplink Latency
Downlink Latency
Retransmit count
Total Packets and Bytes

Key Benefits of Optimizing Latency and Bandwidth

Conclusion

Network KPIs are fundamental for evaluating and improving network performance. As businesses and consumers rely more on digital services, optimizing these metrics becomes imperative for delivering seamless connectivity. By leveraging advanced network observability strategies of ASN, Networks can enhance user experience, reduce delays, and ensure robust performance. Monitoring and optimizing latency and bandwidth will continue to be essential in the evolution of next-generation networking technologies.
Categories
Network Observability Open Networking Enterprise Suite SONiC

Spectrum-X and ONES: End-to-End Observability for GPU Networks

The latest release of Open Networking Enterprise Suite (ONES) marks a significant milestone in network observability, introducing comprehensive telemetry support for Spectrum-X switches. This update extends the robust monitoring capabilities of ONES to Cumulus Linux, providing deep visibility into network performance, health, and traffic patterns.In today’s rapidly evolving networking landscape, achieving end-to-end visibility is paramount for maintaining optimal network performance and swiftly addressing potential issues. With ONES, Aviz Networks ensures that organizations leveraging Cumulus Linux 5.9, 5.10, and 5.11 can achieve end-to-end network visibility, enabling efficient troubleshooting, enhanced security, and performance optimization.

Why End-to-End Visibility Matters for Cumulus Networks

End-to-end visibility refers to the comprehensive monitoring and analysis of data as it traverses the entire network infrastructure. This holistic perspective is essential for:
Without such visibility, network administrators often find themselves reacting to issues after they impact operations, leading to increased downtime and reduced efficiency.
As modern data centers become increasingly complex, ensuring seamless monitoring across all network components is critical. Lack of visibility can lead to:
To address these challenges, ONES supports agentless telemetry for Cumulus, delivering real-time insights into device health, interfaces, traffic statistics, and protocol performance.

Comprehensive Integration with Spectrum-X

Agentless Telemetry Collection

ONES supports Cumulus Linux in an agentless manner, leveraging NVUE (NVIDIA User Experience Daemon) and NGINX for telemetry data collection. NVUE exposes telemetry data through REST APIs, and NGINX acts as a web server to serve these API requests. This enables seamless integration and eliminates the need for additional agents.

Real-World Insights

Advanced Rule Engine for Proactive Monitoring

ONES 3.1 integrates an advanced Rule Engine that enhances network management by providing automated alerts and notifications. This feature allows administrators to:

AI/ML Topology Visualization

ONES provides comprehensive topology visualization with full support for Cumulus devices. Users can:

Benefits of Deploying ONES with Cumulus Devices

Implementing ONES within a Cumulus-powered network infrastructure offers several advantages:

Conclusion

ONES sets a new standard for network observability, delivering end-to-end visibility for Spectrum-X platforms. With agentless telemetry, extensive metrics coverage, and unified monitoring, it empowers organizations to optimize network performance, security, and operational efficiency.

FAQs

1. What is end-to-end observability in Spectrum-X networks and why is it important?

End-to-end observability refers to the ability to monitor data flow and network health from source to destination across the entire infrastructure. In Spectrum-X environments, this ensures reduced latency, faster troubleshooting, and better performance tuning—especially vital for AI/ML workloads and RDMA (RoCE) traffic.

ONES collects telemetry using NVUE (NVIDIA User Experience Daemon) via REST APIs and serves it through NGINX, eliminating the need for extra agents. This streamlines deployment while ensuring real-time visibility into Cumulus devices running versions 5.9, 5.10, and 5.11.

Yes. ONES 3.1 offers unified observability across SONiC and Cumulus Linux devices through a single interface—simplifying network monitoring in hybrid, multi-vendor environments and enabling consistent rule-based alerts and insights.

ONES provides detailed metrics on Priority Flow Control (PFC) and queue-level performance, enabling visibility into RoCE packet flows. This is critical for achieving lossless communication in GPU-driven AI clusters and fine-tuning fabric behavior.

  • Unified network monitoring across vendors
  • Real-time alerts with an advanced Rule Engine
  • Visual topology for AI/ML fabrics
  • Better compliance through complete traffic visibility
  • Scalability to support growing data center demands
Categories
Aviz Service Nodes Network Observability

Enhancing Application Observability: Significance of ASN in IP Traffic Analysis

Introduction

In today’s digital landscape, data centers, edge & distributed infrastructure, enterprise & campus networks, and FTTH (Fiber to the Home) networks are critical components of the modern business, supporting everything from cloud services and enterprise applications to high-speed internet connectivity for consumers. As businesses grow and technology continues to advance, the need for more efficient and effective management of these network environments becomes ever more critical. This is where the Aviz Service Node (ASN) comes in. ASN is a powerful network solution designed to optimize network operations by providing enhanced traffic observability, performance metrics, and network management capabilities. By deploying ASN in a data center, edge & distributed infrastructure, enterprise & campus network or FTTH environment, organizations can ensure better control, improved application performance, and more efficient network traffic handling. In this blog, we’ll explore how ASN is revolutionizing network management and why it is becoming an essential tool for modern network operations.

Challenges Faced in Network Infrastructures

ASN for IP Traffic Analysis

IP Session Management

ASN has the capability to analyze high-volume traffic, extracting millions of IP sessions with precision.It stores all the sessions in memory to achieve high performance packet processing and higher throughput. Processing IP packets from DC/FTTH/Edge/Campus network and tracking sessions based on IP Tuples to create Metadata for each session. Data Center and FTTH Network Traffic Analysis involves the processing of IP packets originating from IP network environments. By analyzing these IP packets and tracking sessions, Metadata is generated for each unique session. This Metadata can include information like session duration, total bytes transferred, application protocol used, and potentially other relevant details depending on the analysis requirements. This extracted Metadata is then used for a variety of purposes, such as network performance monitoring, traffic engineering, capacity planning, security analysis, and application behavior understanding.

Protocol Decoding and Header Stripping

In the realm of network traffic analysis, gaining observability into the actual payload of encapsulated packets is crucial for comprehensive insights. To achieve this, ASN employs techniques like protocol decapsulation and header stripping. This process involves removing the outer headers of encapsulation protocols, revealing the original packet within.

Supported Protocols

By supporting decapsulation and header stripping, ASN helps achieve the following:

Application Identification

ASN with a robust Deep Packet Inspection (DPI) engine enhances the granular observability and control over network traffic within a data center environment. This approach enables the identification and classification of a wide array of applications traversing the network. Currently, the DPI engine supports the identification of over 500+ applications, showcasing its extensive capabilities in application observability. Furthermore, there are plans to significantly expand this capability, with a roadmap aiming to support the identification and classification of over 1000 applications in the near future. This expansion will provide even greater insights into application usage patterns and potential network optimization opportunities.
Application identification in ASN is achieved by below methods:

KPI Calculation

Exporting Session Metadata

Comprehensive session metadata, encompassing APP (Application), KPI (Key Performance Indicator), and detailed session information, can be exported to external systems via Kafka. This facilitates further analysis, long-term storage, and integration with other network management and monitoring tools.

High-Frequency KPI Export

To maintain optimal performance and rapid anomaly detection, KPI data is exported every 5 seconds—a crucial capability that ensures real-time insights into network health. This is achieved through efficient buffering, parallel processing, and low-latency Kafka integration, ensuring that large volumes of session data are aggregated and transmitted without bottlenecks. The system to maintain consistent throughput, even under peak network load to support time-bound KPI insights without delays or data loss.

Real-Time Alerts

Critical scenarios within the network, such as session deletion, release, or handover based on priority, can trigger real-time alerts. These alerts are immediately exported via Kafka to notification systems, enabling rapid response and mitigation of potential network issues.

Timestamping for Time Series Analysis

To enable granular time-based analysis, both packets and sessions are meticulously timestamped within the ASN. These timestamps record the creation time, the last seen time, and the export time, providing valuable insights into network traffic patterns and trends over time.
KPIS Per Session Per Application Per Region
Throughput/Bandwidth
Uplink Latency
Downlink Latency
Retransmit count
Total Packets and Bytes

Packet Deduplication

In a data center environment, there can be a significant amount of duplicate traffic, particularly in applications that involve large file transfers or streaming media. ASN Packet deduplication can help to reduce this redundancy by identifying and removing duplicate packets before they are transmitted across the network. ASN provides a powerful tool for customizing deduplication configurations in network traffic analysis. Packet deduplication within ASN involves customizable parameters like Packet Source, Anchor, Offset, and Window Size.

Packet Capture

In dynamic network environments like Data Centers (DC) deployments, where traffic patterns and types vary unpredictably, Aviz Service Node (ASN) systems are essential for handling traffic at line rate. To ensure smooth operations and address any issues in real-time, packet capture becomes an invaluable tool.The packet capture feature allows network administrators to monitor live traffic flowing through the ASN without disrupting its primary functions. This capability is crucial for effective debugging, troubleshooting, and performance analysis in complex, high-traffic environments, where insights from live network data are vital to maintaining operational stability. By enabling live traffic capture, packet capture ensures that administrators can diagnose and analyze network behavior instantly, supporting proactive management in ever-evolving network landscapes

Benefits of ASN for IP Traffic Analysis

FAQs

1. What is ASN and how does it enhance IP traffic analysis in modern networks?

 Aviz Service Node (ASN) is a high-performance observability solution designed for data centers, edge, FTTH, and enterprise networks. It enables real-time IP traffic analysis by tracking millions of IP sessions, generating metadata, and delivering actionable insights on application behavior, throughput, and latency.

ASN uses a robust Deep Packet Inspection (DPI) engine that supports over 500+ applications (with plans to expand beyond 1000), identifying them via pattern matching, Server Name Indication (SNI), global IP mapping, and port-based techniques for precise application-level observability.

Yes. ASN supports protocol decapsulation and header stripping for GRE, ERSPAN, VxLAN, PPPoE, L2TP, and IPoE, enabling deeper packet inspection by revealing encapsulated payloads—essential for troubleshooting, efficiency, and root cause analysis.

ASN exports enriched session metadata and KPIs via Kafka every 5 seconds, allowing real-time visibility and fast anomaly detection. It also triggers alerts for critical events like session deletions or handovers, ensuring swift incident response.

Duplicate packets inflate bandwidth usage and distort performance metrics. ASN uses intelligent, configurable packet deduplication to eliminate redundant traffic, improving monitoring accuracy and network efficiency across high-throughput environments.

Categories
Network Observability

The Status Quo of Not Innovating in Network Observability: 5 Reasons Why Incumbent Solutions Are Holding You Back

Network observability is the lifeline of any modern digital infrastructure. Yet, for a space that’s so critical, it’s stuck in time. While the rest of the tech world is sprinting forward—driven by AI, cloud-native models, and vendor-neutral strategies—network observability is still clinging to a status quo that’s not just outdated, but actively limiting.

Let’s break it down. Here are five reasons why incumbent network observability solutions are failing us:

1. Still Hardware-First in a Software-First World

In nearly every part of the infrastructure stack—from storage to compute to networking—we’ve seen a clear shift: software first, hardware second. Flexibility, scalability, and rapid innovation are made possible by decoupling software from rigid, proprietary hardware.

Yet, most legacy network observability solutions still demand specialized boxes and appliances. Want to scale? Add more hardware. Want to adapt quickly? Sorry, you’re locked into a lifecycle that moves at the speed of hardware refreshes.

2. FPGA-Based Inspection in the Age of Commodity Hardware

Let’s be honest—specialized hardware like FPGAs made sense once. But that was before we had powerful CPUs, DPDK, and smart NICs. While the rest of the world moved to commodity hardware, incumbents are still selling FPGA-based packet brokers and inspection tools like it’s 2010.
It’s expensive. It’s rigid. It’s power-hungry. And it’s not necessary anymore.

3. Zero Interoperability – The Multi-Vendor Wall

You’d think by now, standardization would be a given in a mature space like this. But no—every legacy vendor still pushes their own closed ecosystem. Want to mix vendors or tools? Good luck. You’ll need custom integrations, proprietary interfaces, and a whole lot of patience.
This kind of lock-in doesn’t just slow you down—it kills your ability to innovate and optimize.

4. Outdated Pricing Models

Imagine paying per port, per chassis, or per feature toggle in 2025. That’s what you’re still doing with many observability vendors.

Modern infrastructure is elastic. Pricing should be too. But these old-school models bleed your budget dry and offer zero alignment with actual usage or value.

5. No AI, No Intelligence

Perhaps the most glaring sign of the status quo? A complete absence of AI built for network observability. While enterprises apply AI to observability, automation, and security—observability tools are still glorified packet movers.

There’s no intelligence to connect insights in real-time, correlate across layers, or surface actionable anomalies. And in a world of LLMs, that’s just inexcusable.

So, What’s the Alternative? Meet Aviz.

At Aviz, we’ve reimagined what network observability should look like. Our Network Observability Portfolio is built for this new era:

And This Isn’t Just Theory.

A major telco deployed our solution in the capital region of one of the biggest economies in the world, serving 30 million subscribers. Data is processed with 5-second granularity, enabling precise, real-time insights.

Results?

Why? Because we broke the status quo. Because we standardized the observability layer. Because we believe that network observability deserves innovation too.

Want to learn how we did it?

We’d love to show you what a modern observability stack can really do.

FAQs

1. Why are legacy network observability tools considered outdated in today’s infrastructure?

Legacy tools rely on hardware-first approaches, proprietary FPGAs, and rigid pricing models that don’t align with today’s software-first, AI-driven, and multi-vendor ecosystems—making them costly, inflexible, and slow to evolve.

While once necessary, FPGA-based tools are now power-hungry, expensive, and unnecessary. Modern observability can be powered by software-defined solutions running on commodity CPUs or smart NICs, offering better flexibility and scalability.

Vendor lock-in limits interoperability, slows innovation, and prevents IT teams from integrating best-of-breed solutions—leading to inefficiencies, higher costs, and reduced agility across observability and analytics workflows.

Aviz offers an open, AI-connected observability stack that supports multi-vendor environments, runs on commodity CPUs (or NVIDIA BlueField DPUs when needed), and integrates TestWork Copilot for intelligent, real-time insights—no lock-in required.

 A major telco using Aviz achieved:

  • 80% reduction in hardware footprint
  • 50% drop in operational costs
  • 5-second telemetry granularity.
    These results were possible due to standardization, CPU-based design, and AI-connected observability.
Categories
Network Observability

Love the Idea of Multi-Vendor, But Don’t Want the Risk? Start with Network Observability

Let’s be honest — every network leader today has asked the question:

“Can I go multi-vendor?”

And just as quickly, the doubts follow:
Fair concerns. After all, the network is mission-critical.
But here’s the answer:

Start where the risk is low, impact is high, and the insights are immediate. Start with your network observability stack.

Why Visibility Is the Ideal Place to Start Your Multi-Vendor Journey

1. It's Passive by Nature.

You’re not routing packets. You’re observing them. That means no disruption to traffic, no downtime risk, and no changes to your core infrastructure.
You get full visibility into what’s happening across your network — without putting it in harm’s way.

This is what we call a calculated risk. The kind smart network leaders take.

2. You Get to See Multi-Vendor in Action — Before Going All-In

Standardize your packet broker and service nodes at the visibility layer. Use software-first, vendor-neutral platforms like Aviz that can plug into any environment — Cisco, Arista, NVIDIA, Broadcom, and more.

This gives you a real-world look at:

Spoiler: it’s often 50%+ in direct costs and 70%+ ROI over the lifecycle of the solution.

3. Your Data Center Footprint Shrinks

When you replace FPGA-based appliances with software-powered visibility nodes, running on commodity hardware or CPUs (and accelerating only when needed using DPUs like NVIDIA BlueField), the results speak for themselves:

One of our large telco deployments — in the capital region of one of the world’s biggest economies — saw an 80% reduction in hardware footprint, while supporting 30M+ subscribers with data granularity every 5 seconds.

That’s not an upgrade. That’s a transformation.

And Even If It Doesn’t Work — Your Core Network Is Still Untouched

That’s the beauty of starting with visibility.
Worst case? You gain insight, experience, and metrics — and you go back to your old model. Your core routing, switching, and orchestration aren’t affected. Your customers never notice. Your ops team just got smarter.
Best case?

This Is How Every Disruption Begins

Most OEMs didn’t enter the network through the front door. They started where the stakes were lower — passive networks, test environments, monitoring layers.

Visibility was the Trojan Horse.

Now it can be your bridge to innovation.

If You’ve Ever Thought About Going Multi-Vendor — This Is Your Moment

Try it. Measure it. Stress-test it.
And then decide from a position of data, not fear.

Start with visibility. Make it software-first. Standardize the layers that matter.

Let Aviz show you what’s possible — safely, intelligently, and cost-effectively.
And Here’s How We’re Already Doing It

A leading telco, serving over 30 million subscribers in the capital region of one of the world’s largest economies, partnered with Aviz to modernize their network observability stack.

They took the calculated risk.

They replaced expensive, proprietary hardware with a multi-vendor, software-defined visibility platform — powered by Aviz.

The result?

They now have the proof — multi-vendor visibility works. It’s efficient. It’s scalable. And it opens the door to future innovation across the entire network.

This is how you start.

Low risk. High reward.
The first step to breaking free from vendor lock-in and building an intelligent, open, AI-connected network.

Let’s talk. Let’s try. Let’s build the future — one layer at a time.

FAQs

1. What is the safest way to begin a multi-vendor network deployment?

The safest place to start is at the network observability layer. It’s passive by design — it doesn’t alter traffic flow or core infrastructure — allowing teams to evaluate multi-vendor environments without risking downtime or service disruption.

By integrating a vendor-neutral observability platform like Aviz at the visibility layer, organizations can assess:

  • Cross-vendor integration behavior
  • Support dynamics
  • Operational workflows
  • ROI and cost savings in real time

This gives a risk-free preview of multi-vendor capabilities before making a full switch.

Replacing legacy appliances with software-powered visibility nodes (running on commodity hardware or DPUs like NVIDIA BlueField) offers:

  • Up to 80% reduction in hardware footprint
  • Lower power and cooling requirements
  • Improved scalability and flexibility
  • Substantial capex and opex savings

No. The observability layer operates independently from routing and switching infrastructure, ensuring that even in a worst-case scenario, the core network remains untouched and fully operational.

A major telco with 30M+ subscribers replaced proprietary appliances with Aviz’s multi-vendor visibility stack and achieved:

  • 80% less hardware usage
  • 50% reduction in operational costs
  • 5-second telemetry across vendors
  • Zero impact on their production network

They now have live proof that multi-vendor observability works — efficiently and at scale.

Categories
Network Observability Open Networking Enterprise Suite

ONES 2.1: Advancements in Network Observability with Multi-NOS Telemetry, AI-Fabric Anomaly Detection, and Data Lake Integration

We’re thrilled to unveil ONES 2.1, a revolutionary network management and operations solution that redefines the benchmarks for Visibility, Orchestration, and Support. This release marks a monumental stride in our unwavering dedication to pushing the boundaries of network management capabilities and orchestration. Packed with cutting-edge features, ONES 2.1 introduces a groundbreaking ONE Data Lake which integrates with AWS S3 and Splunk, addition of multi-vendor NOS (NXOS, EOS, Cumulus) visibility, extended platform metrics (SSD Health, Device Failure detection, etc and enhanced anomaly and alerting mechanism for AI-Fabric.
Prepare to embark on a journey where innovation intersects with excellence, as ONES 2.1 empowers your network endeavors with unparalleled sophistication and efficiency. It’s more than just a tool; it’s a paradigm-shifting innovation meticulously designed to enhance your network experience to levels never seen before.

ONE-DL with AWS S3 and Splunk:

In the 2.1 release of ONES, a cloud data lake has been introduced, featuring integration with AWS S3 and Splunk. This integration enables seamless migration of ONES telemetry data to the customer defined storage nodes hosted either in Cloud or On-Prem, paving the way for custom data analytics use cases. By leveraging cloud infrastructure and analytics tools, ONES users can unlock deeper insights from their network data, enhancing decision-making and operational efficiency.

Multi-NOS Telemetry

ONES now supports Multi-NOS network telemetry including Cisco NX-OS, Arista EOS and Cumulus NOS. This addition expands ONES capabilities to manage networks with diverse non-SONiC Network Operating Systems (NOS), establishing ONES as a versatile multi-vendor platform tool. Users can now benefit from centralized network management across various vendor environments, enhancing efficiency and flexibility in network operations.

Advanced Telemetry for SONiC Support

SSD Health: SSDs are considered reliable, with a mean time to failure of one to 1.5 million hours indicating a low annual failure rate. Despite this, they are often the most frequently replaced component in large-scale IT infrastructures and data centers, where many failures are attributed to SSD malfunctions. It is crucial to use comprehensive monitoring to detect failing SSDs, ensuring data availability and preventing data loss.
AI-Fabric Anomaly Detection & Alerting: RoCE-related metrics have been incorporated into our rule engine service, enhancing the ability of our support team to automatically troubleshoot and alert for anomalies in the network fabric used by GPUs. This integration includes interface, queue, and PFC counters, in addition to existing metrics for detecting failures such as link and device failures. These enhancements make ONES an all-encompassing tool for our support team to diagnose and optimize AI-Fabric deployments.

Enhanced Orchestration Capabilities

Network Config Illustrator: The Network Config Illustrator is a specialized tool crafted to generate visual representations of network topologies using input configuration files. Its core objective is to offer users a tangible depiction of their network structure, offering a glimpse into how the real network diagram might appear. This aids users in comprehending and analyzing their network setups more effectively.

Over 70+ Pre-Validated Templates: Pre-validated templates, meticulously crafted to simplify network management across various use cases. These templates are designed to empower network professionals with ready-to-use configurations, reducing deployment time, minimizing errors, and enhancing overall efficiency. Access the templates here: Aviz Networks GitHub – YAML Templates 2.1

Improvised Fabric Manager CLI: FMCLI now offers extended support for multi-vendor environments, accommodating both x86 and ARM devices. Multi-session Support, ensuring that each session maintains its integrity avoiding accidental overrides and empowers users to work confidently, knowing that their configurations are protected and their workflow remains uninterrupted.
Discover the unparalleled capabilities of ONES 2.1 tailored for SONiC, featuring a suite of innovative functionalities and enhanced user interface. Revolutionize your network orchestration and management with these cutting-edge advancements!
Embark on your path to seamless network monitoring and orchestration today.

FAQs

1. What are the key new features introduced in ONES 2.1 for network observability and management?

ONES 2.1 introduces major enhancements, including ONE Data Lake integration with AWS S3 and Splunk, multi-NOS telemetry for NX-OS, EOS, and Cumulus, SSD health monitoring for SONiC platforms, advanced AI-Fabric anomaly detection, and extended orchestration capabilities with visual network topology tools and pre-validated configuration templates.

The ONE Data Lake integration allows ONES telemetry data to be stored on AWS S3 or Splunk platforms, enabling scalable storage, advanced analytics, historical trend analysis, and customized insights for predictive network management, enhancing operational decision-making and proactive maintenance.

ONES 2.1’s multi-NOS telemetry extends network observability beyond SONiC to include Cisco NX-OS, Arista EOS, and Cumulus Linux. This empowers enterprises to achieve unified visibility and centralized management across diverse multi-vendor environments, reducing operational silos and boosting cross-platform efficiency.

ONES 2.1 integrates RoCE metrics into its rule engine, enabling automatic detection of fabric-related anomalies such as congestion, link failures, and device malfunctions. This advanced alerting mechanism helps optimize GPU-based AI fabrics, improving reliability, performance, and issue resolution times.

ONES 2.1 offers a Network Config Illustrator for visualizing network topologies, 70+ pre-validated configuration templates for rapid deployment, and an improved Fabric Manager CLI (FMCLI) with multi-session and multi-vendor support  streamlining both operational workflows and configuration management across diverse network setups.

Contact Us

ONES 2.1: Advancements in Network Observability with Multi-NOS Telemetry, AI-Fabric Anomaly Detection, and Data Lake Integration

We’re thrilled to unveil ONES 2.1, a revolutionary network management and operations solution that redefines the benchmarks for Visibility, Orchestration, and Support. This release marks a monumental stride in our unwavering dedication to pushing the boundaries of network management capabilities and orchestration. Packed with cutting-edge features, ONES 2.1 introduces a groundbreaking ONE Data Lake which […]